Fig. 1.
Download original image
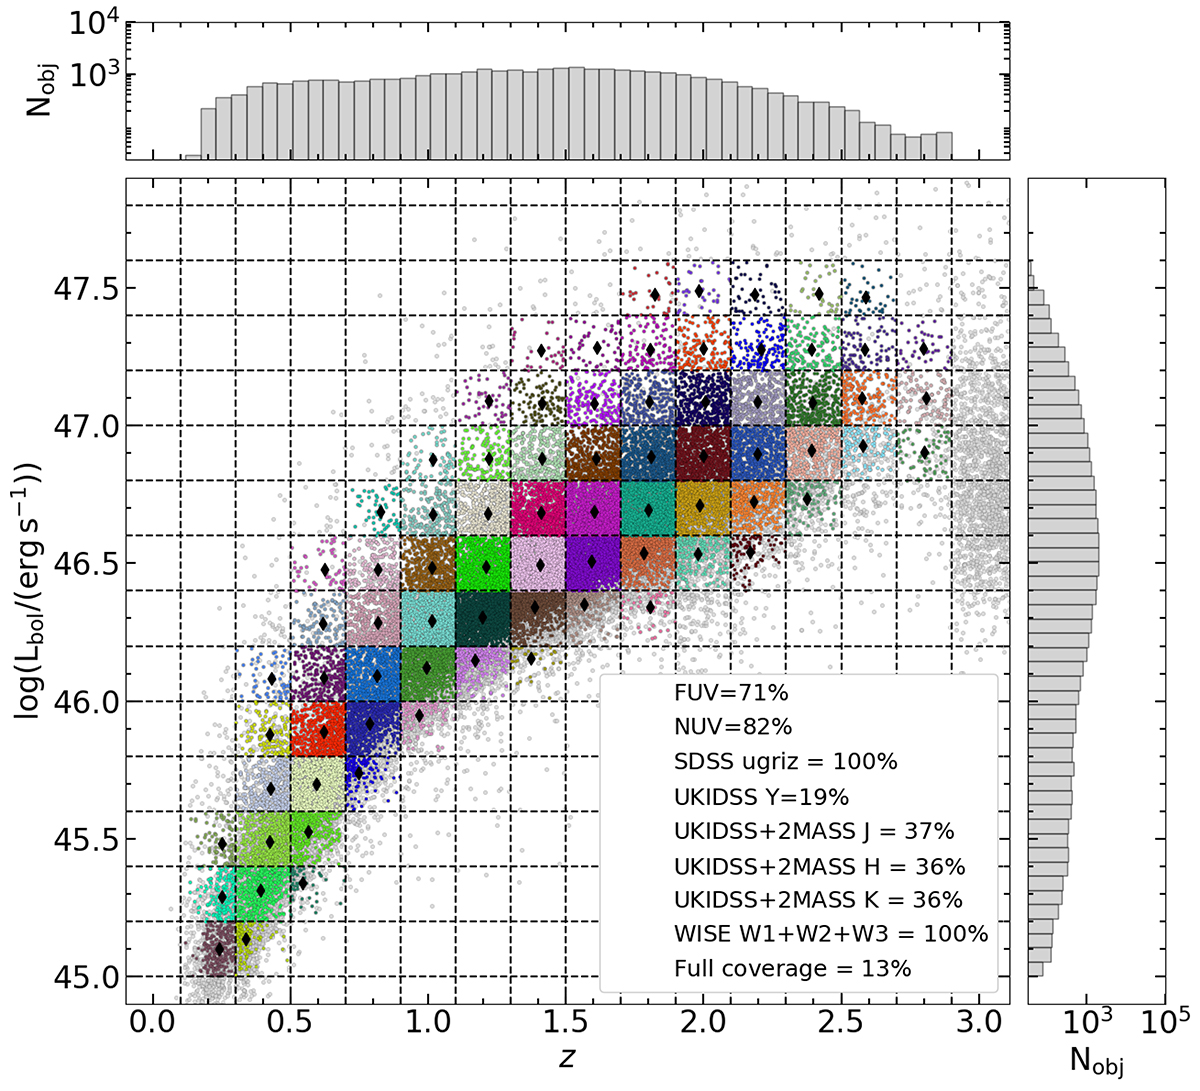
log(Lbol)–z plane for the sources surviving the binning selection and the colour cut (see text for details). The final sample spans roughly 2.5 decades in bolometric luminosity and covers up to z ∼ 2.9. The data are randomly coloured if the bin contains more than 30 objects to make the binning clearer. The black diamonds mark the average z and log(Lbol) values. The legend reports the fraction of sources having data in the labelled band. Since the sample is based on the cross-match between the SDSS and the AllWISE catalogues, all objects have data in the bands covered by these surveys, while only a minority have a full coverage across the several wave bands.
Current usage metrics show cumulative count of Article Views (full-text article views including HTML views, PDF and ePub downloads, according to the available data) and Abstracts Views on Vision4Press platform.
Data correspond to usage on the plateform after 2015. The current usage metrics is available 48-96 hours after online publication and is updated daily on week days.
Initial download of the metrics may take a while.