Open Access
Fig. 8.
Download original image
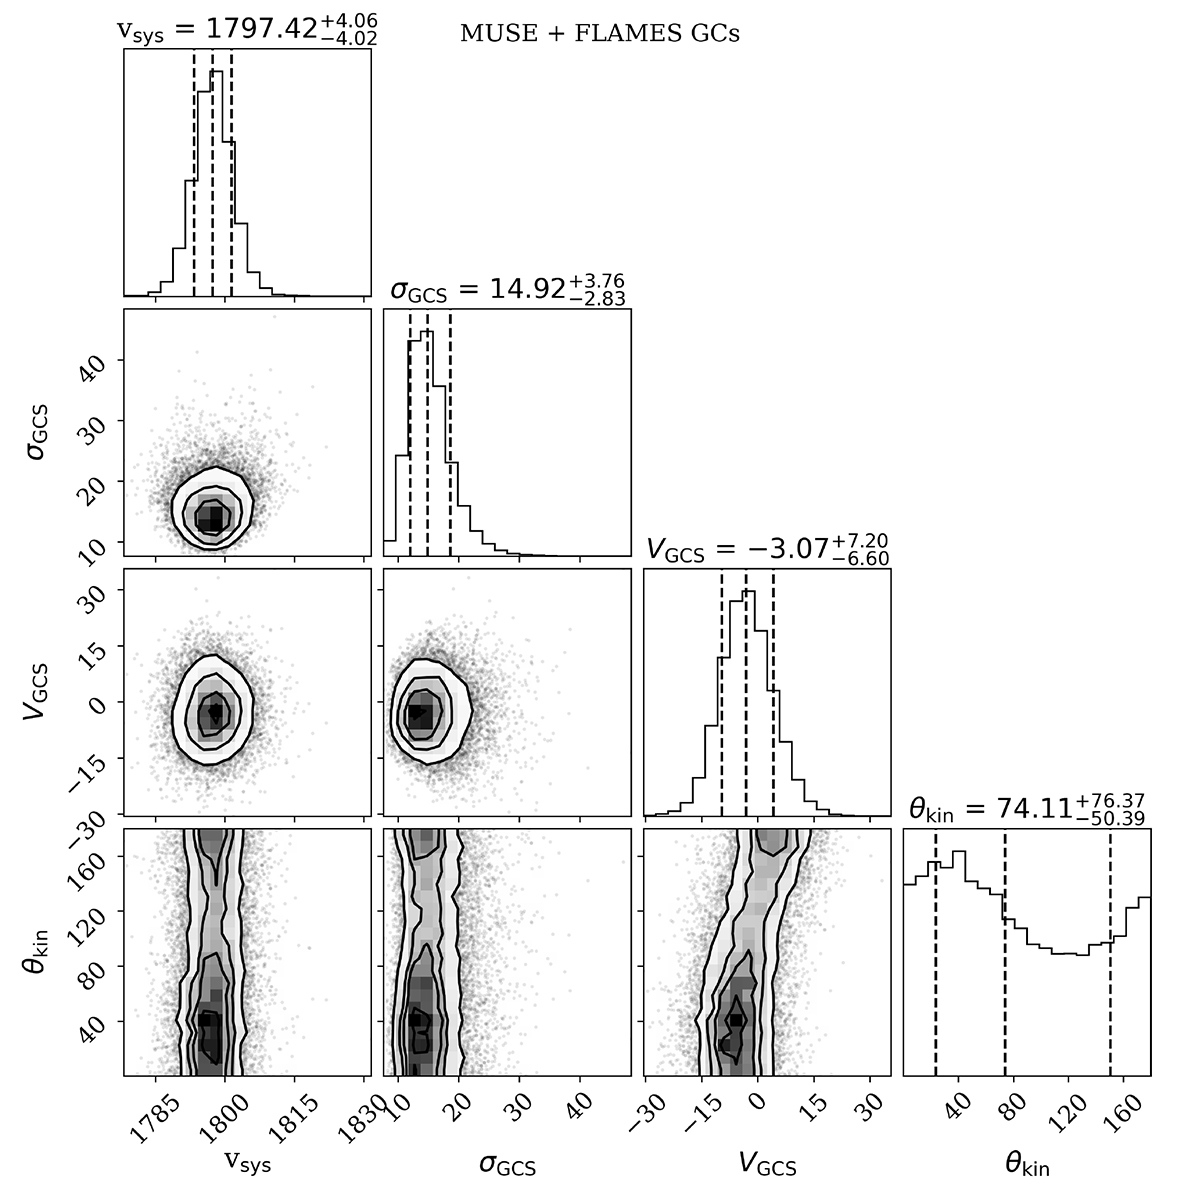
Corner plot (Foreman-Mackey 2016) showing the posterior distributions of our simple kinematic model. The 16th, 50th, and 84th percentiles are indicated in the histograms with dashed lines. The kinematic angle is ill constrained due to the low velocity amplitude.
Current usage metrics show cumulative count of Article Views (full-text article views including HTML views, PDF and ePub downloads, according to the available data) and Abstracts Views on Vision4Press platform.
Data correspond to usage on the plateform after 2015. The current usage metrics is available 48-96 hours after online publication and is updated daily on week days.
Initial download of the metrics may take a while.