Fig. 6.
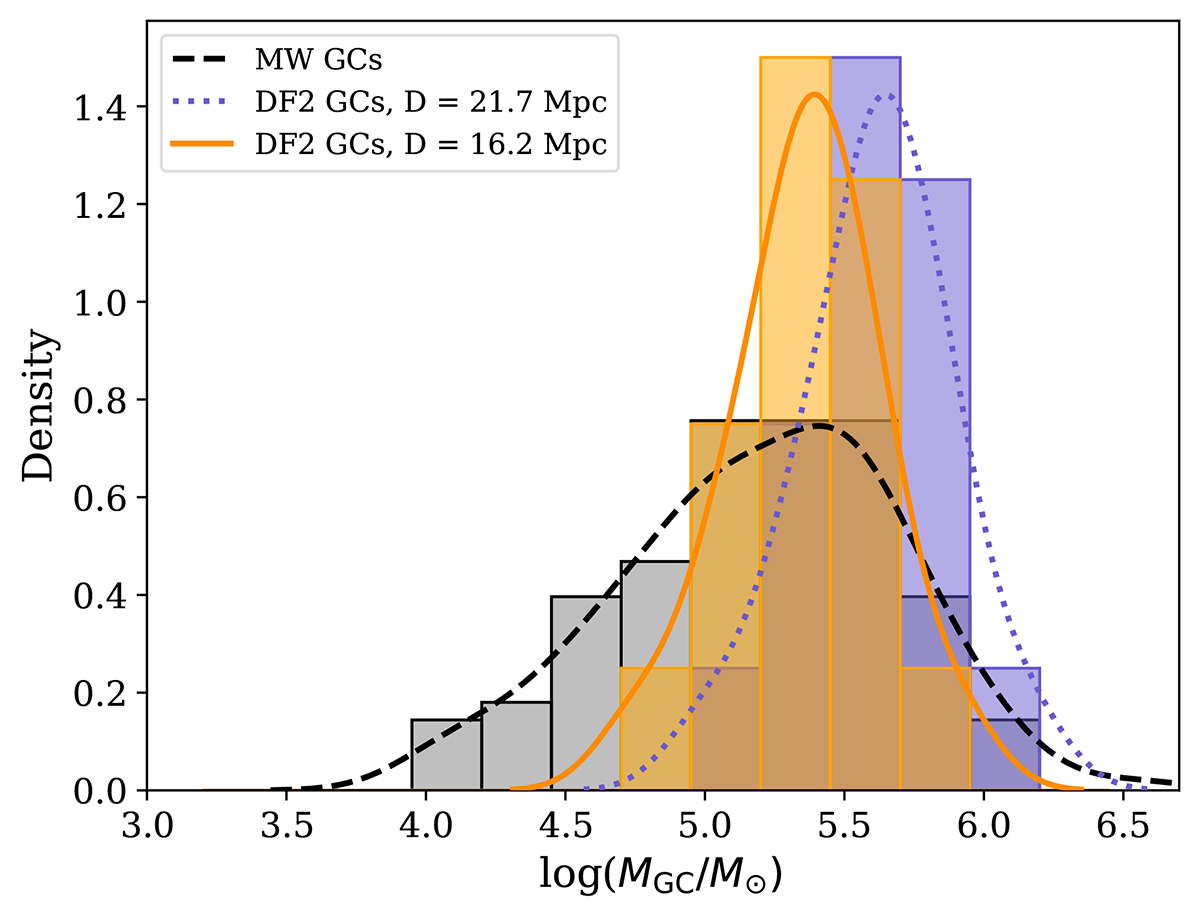
Download original image
Distribution of derived masses based on stellar population properties. The orange histogram shows the NGC 1052-DF2 GCs assuming a distance of 16.2 Mpc, and the orange line shows a kernel density estimation line to visualise the distribution. We note that the histogram only shows the spectroscopically confirmed GCs and that no completeness correction was applied. The purple histogram and corresponding dotted purple line shows the mass distribution assuming a larger distance of 21.7 Mpc. The grey histogram and the black line show the distribution of 112 GCs from the Milky Way from Baumgardt & Hilker (2018).
Current usage metrics show cumulative count of Article Views (full-text article views including HTML views, PDF and ePub downloads, according to the available data) and Abstracts Views on Vision4Press platform.
Data correspond to usage on the plateform after 2015. The current usage metrics is available 48-96 hours after online publication and is updated daily on week days.
Initial download of the metrics may take a while.