Fig. 4.
Download original image
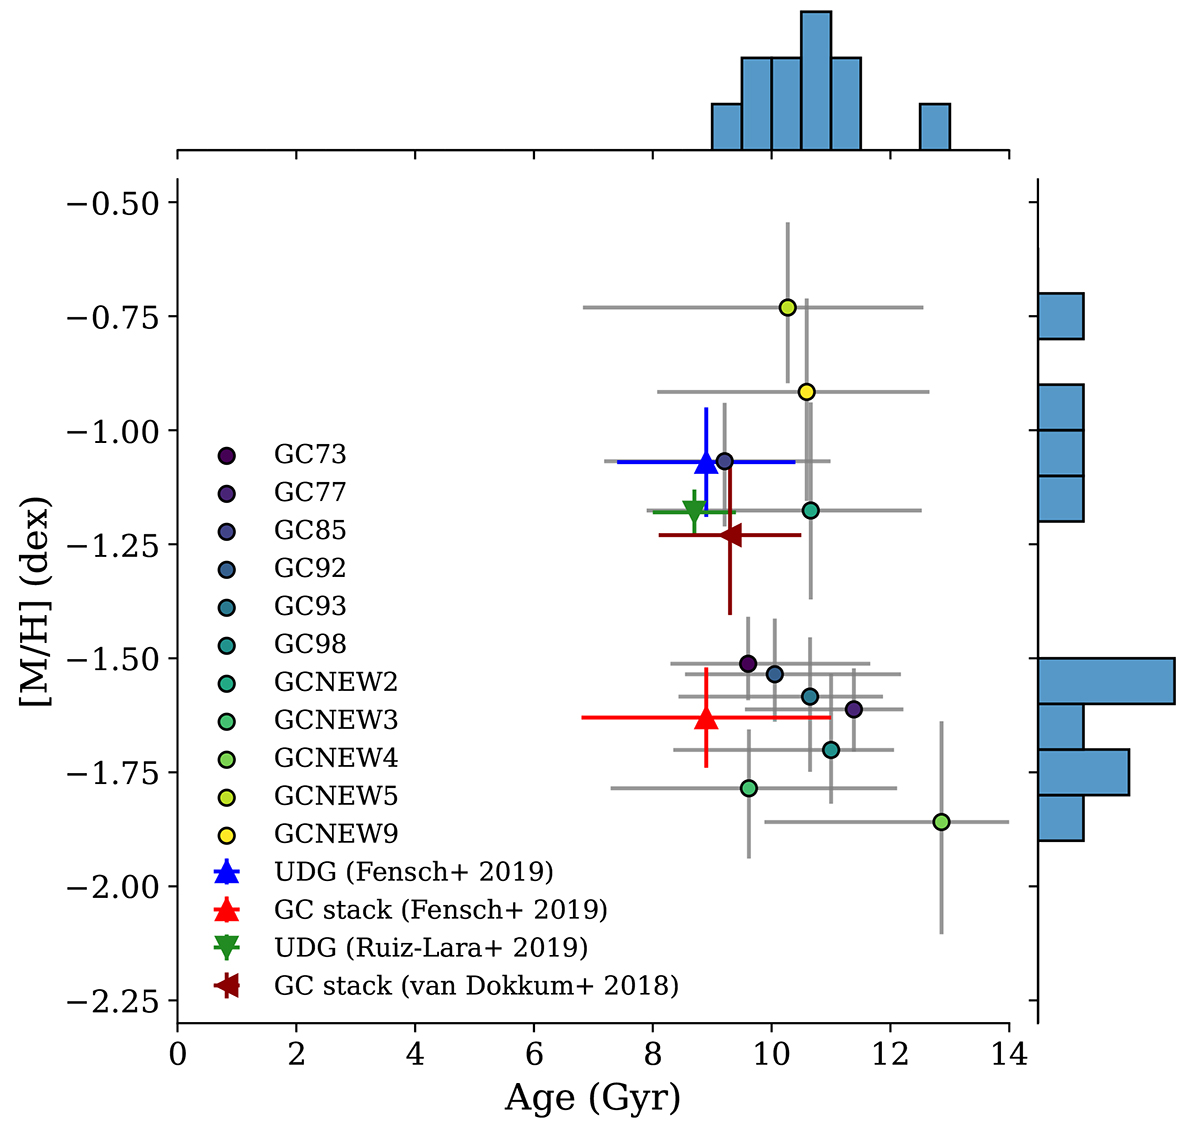
Age versus metallicity of the GCs. Coloured dots refer to the MUSE GCs analysed here. The red cross shows the result from the stacked GC spectrum of Fensch et al. (2019), and the blue cross refers to the UDG itself as determined from an aperture spectrum. The dark red point shows the result from the stacked Keck spectra from van Dokkum et al. (2018c), and the green triangle shows the UDG metallicity from slit spectroscopy presented by Ruiz-Lara et al. (2019).
Current usage metrics show cumulative count of Article Views (full-text article views including HTML views, PDF and ePub downloads, according to the available data) and Abstracts Views on Vision4Press platform.
Data correspond to usage on the plateform after 2015. The current usage metrics is available 48-96 hours after online publication and is updated daily on week days.
Initial download of the metrics may take a while.