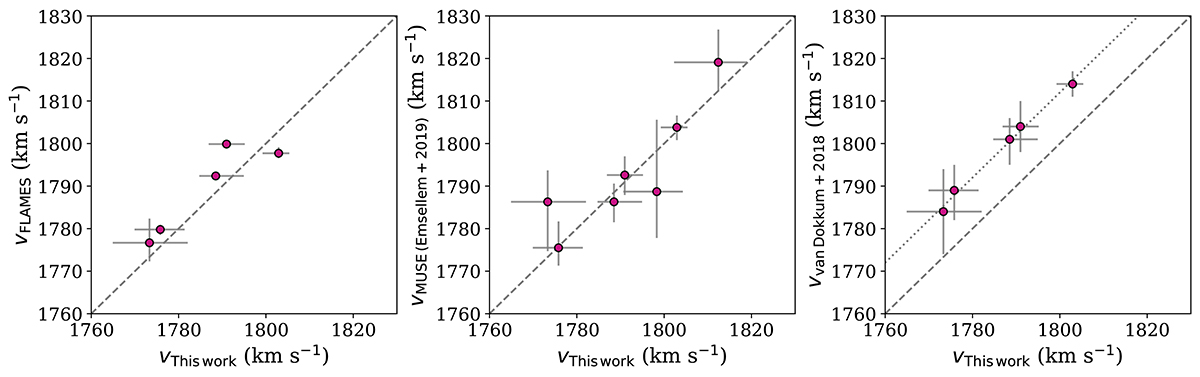
Fig. 3.
Download original image
Comparison of velocity measurements. Left: Comparison of GC velocities from this work based on the MUSE data and from the FLAMES spectra presented in Paper I. Middle: Comparison between this work and GC velocities from the same data as presented in Emsellem et al. (2019). Right: Comparison to GC velocities reported in van Dokkum et al. (2018a,b) from Keck DEIMOS and LRIS spectra. The dashed line shows the one-to-one relation, while the dotted line in the rightmost panel refers to a velocity offset of 12 km s−1 (see also Emsellem et al. 2019).
Current usage metrics show cumulative count of Article Views (full-text article views including HTML views, PDF and ePub downloads, according to the available data) and Abstracts Views on Vision4Press platform.
Data correspond to usage on the plateform after 2015. The current usage metrics is available 48-96 hours after online publication and is updated daily on week days.
Initial download of the metrics may take a while.