Fig. 2.
Download original image
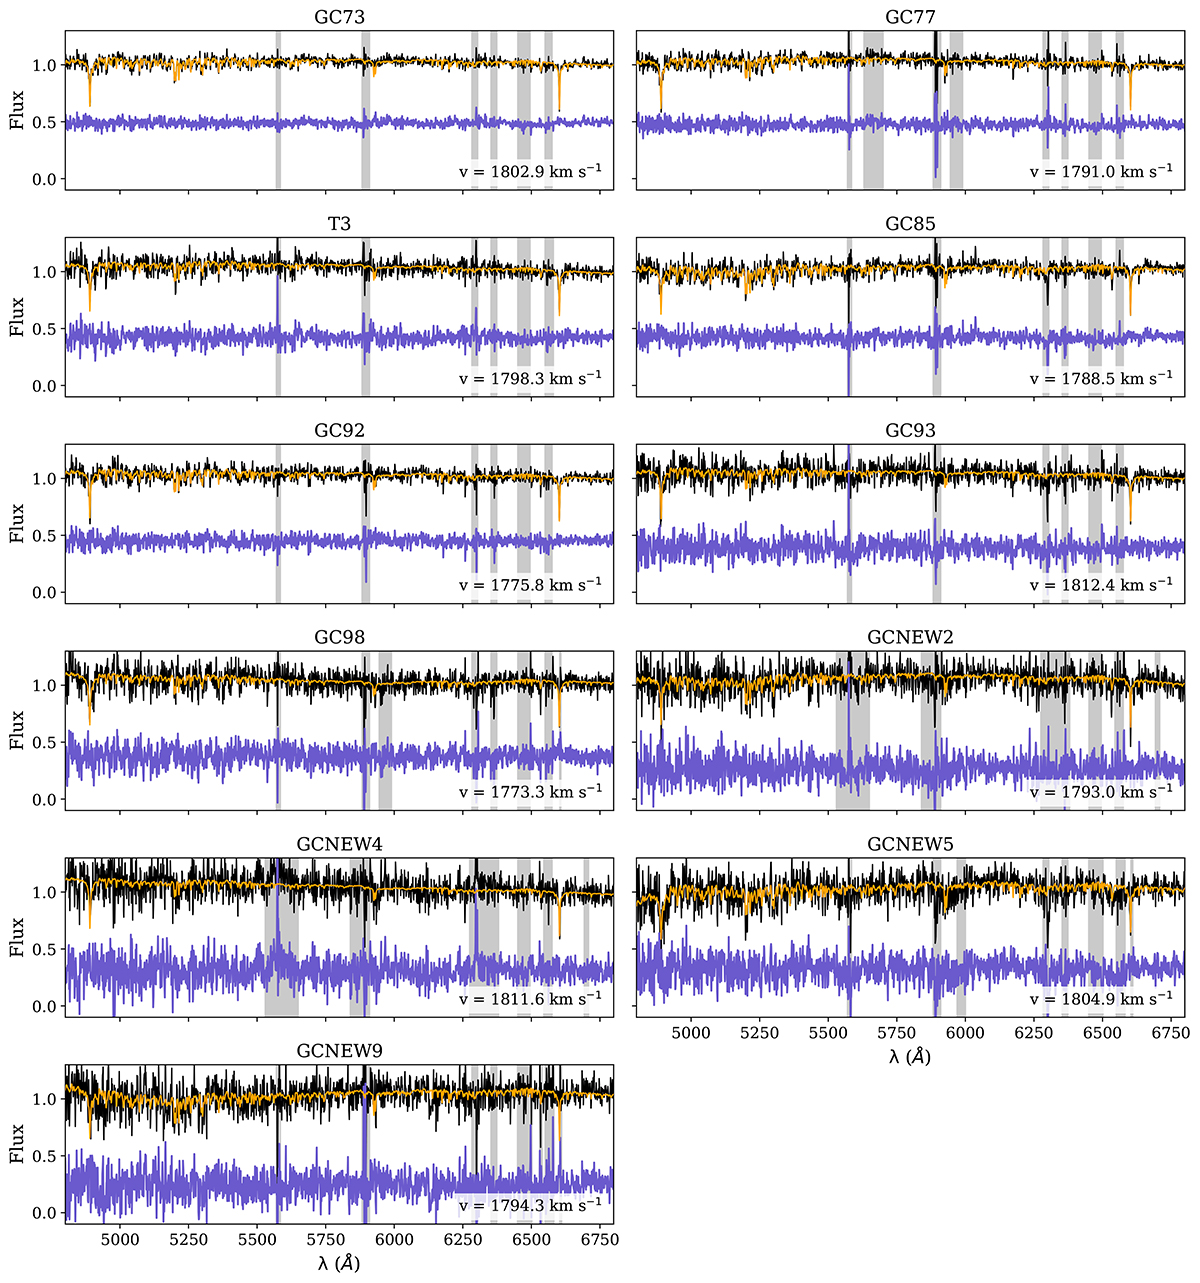
Full spectrum fitting of the GCs. Each panel shows the GC spectrum in black and the pPXF fit in orange. The respective residuals are shown in purple, shifted for visualisation. Grey shaded areas are regions masked from the fit due to sky residual or telluric lines. In the lower right corner, the best-fitting velocity is shown. The panels only show the blue part of the spectrum.
Current usage metrics show cumulative count of Article Views (full-text article views including HTML views, PDF and ePub downloads, according to the available data) and Abstracts Views on Vision4Press platform.
Data correspond to usage on the plateform after 2015. The current usage metrics is available 48-96 hours after online publication and is updated daily on week days.
Initial download of the metrics may take a while.