Open Access
Fig. A.1.
Download original image
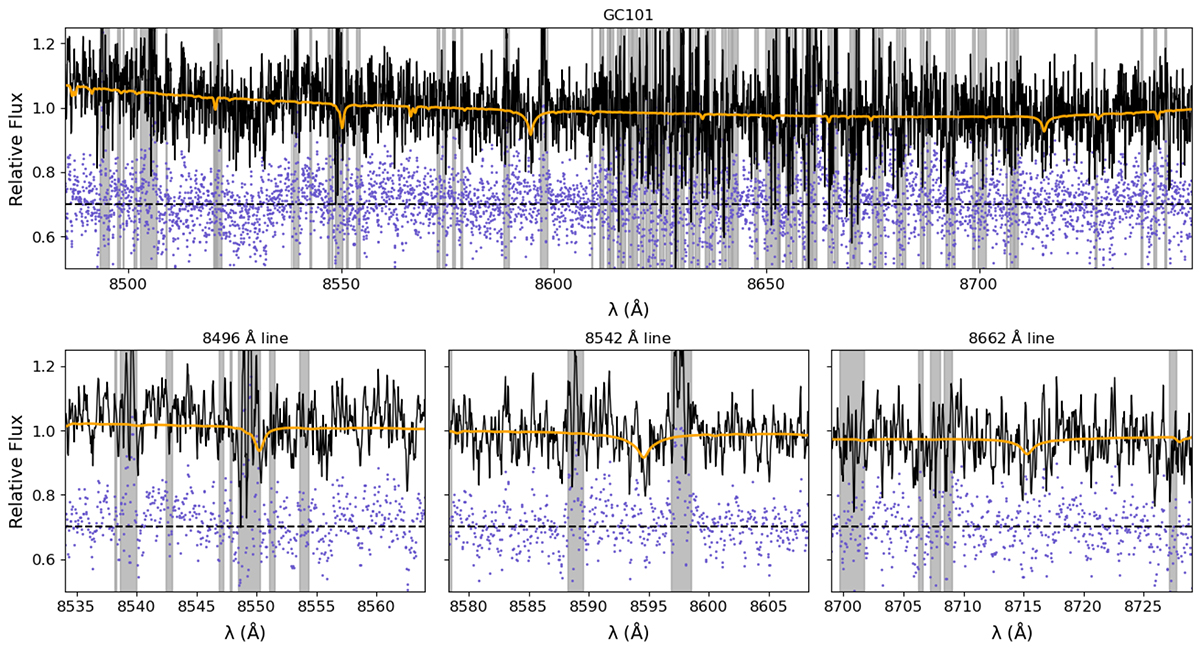
Full spectrum fit to the FLAMES spectrum of GC101. The original spectrum is shown in black, and the best-fit model is shown in orange. Shaded areas indicate masked regions due to sky line residuals. The lower panels show zoomed-in views around the calcium triplet lines.
Current usage metrics show cumulative count of Article Views (full-text article views including HTML views, PDF and ePub downloads, according to the available data) and Abstracts Views on Vision4Press platform.
Data correspond to usage on the plateform after 2015. The current usage metrics is available 48-96 hours after online publication and is updated daily on week days.
Initial download of the metrics may take a while.