Open Access
Fig. 8.
Download original image
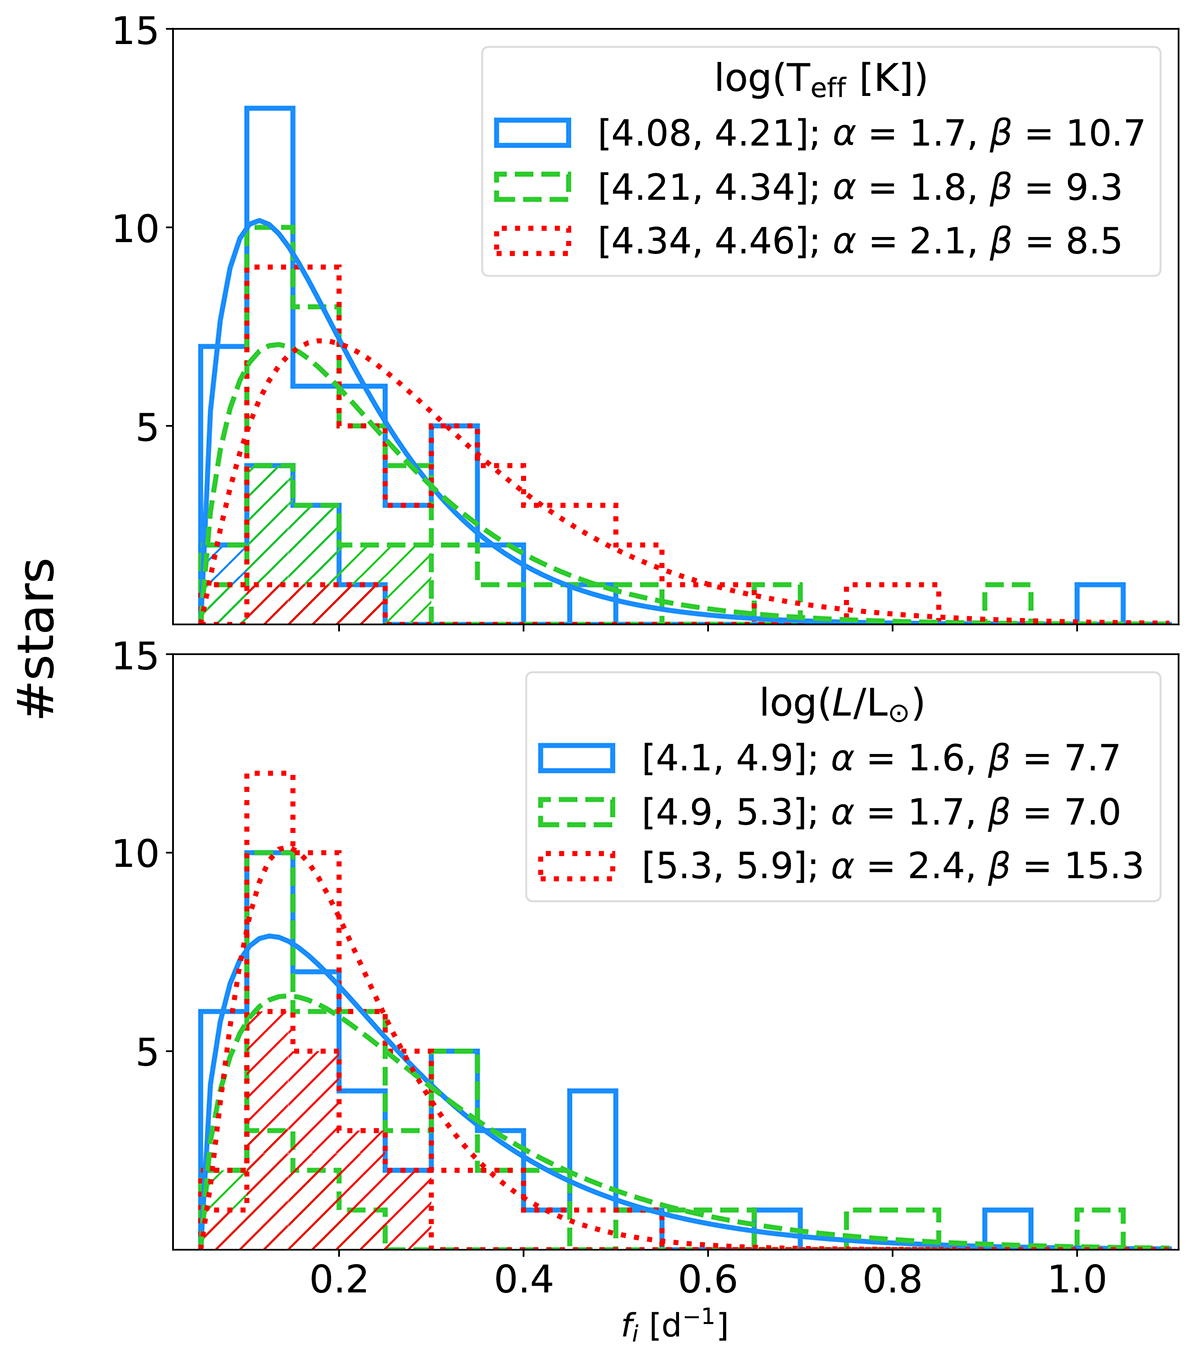
Histograms of the individual BSG frequencies as functions of log Teff (upper panel) and log (L/L⊙) (lower panel). In each plot, the sample is split into three groups based on the parameter values (see the legend). The histograms for the α Cygni variables are indicated with cross-hatching.
Current usage metrics show cumulative count of Article Views (full-text article views including HTML views, PDF and ePub downloads, according to the available data) and Abstracts Views on Vision4Press platform.
Data correspond to usage on the plateform after 2015. The current usage metrics is available 48-96 hours after online publication and is updated daily on week days.
Initial download of the metrics may take a while.