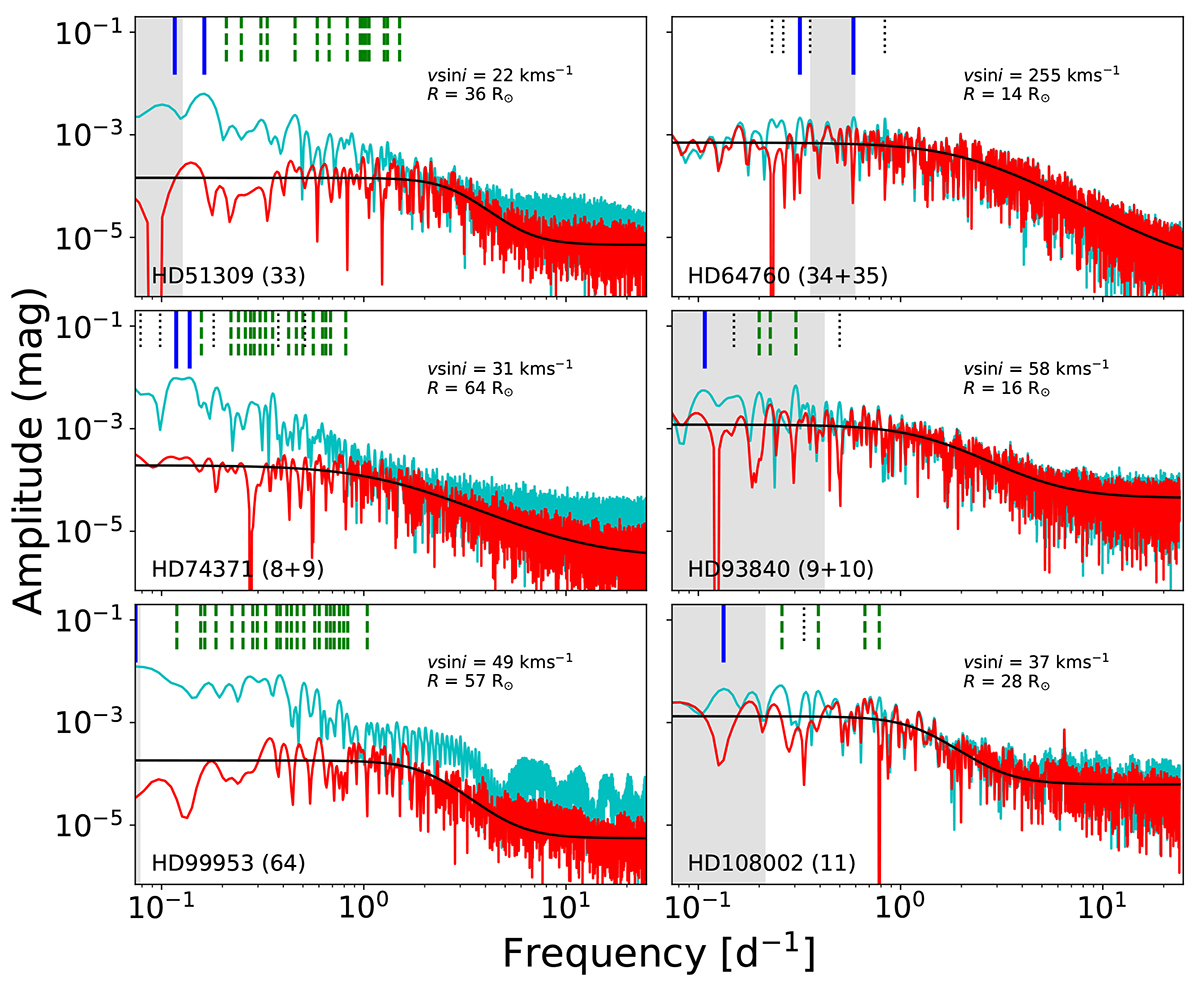
Fig. 3.
Download original image
Frequency spectra of selected BSGs. We show the periodograms calculated at the beginning (cyan) and the end (red) of the pre-whitening process. The vertical lines at the top of each panel point to the different types of identified frequencies: independent (solid), harmonics (dashed), and combinations (dotted). The solid black line corresponds to the best-fit SLF variability model (Eq. (4)) that we adopt for the star. The gray-shaded region indicates the range of frequencies that can be identified as being due to the stellar rotation.
Current usage metrics show cumulative count of Article Views (full-text article views including HTML views, PDF and ePub downloads, according to the available data) and Abstracts Views on Vision4Press platform.
Data correspond to usage on the plateform after 2015. The current usage metrics is available 48-96 hours after online publication and is updated daily on week days.
Initial download of the metrics may take a while.