Fig. 2.
Download original image
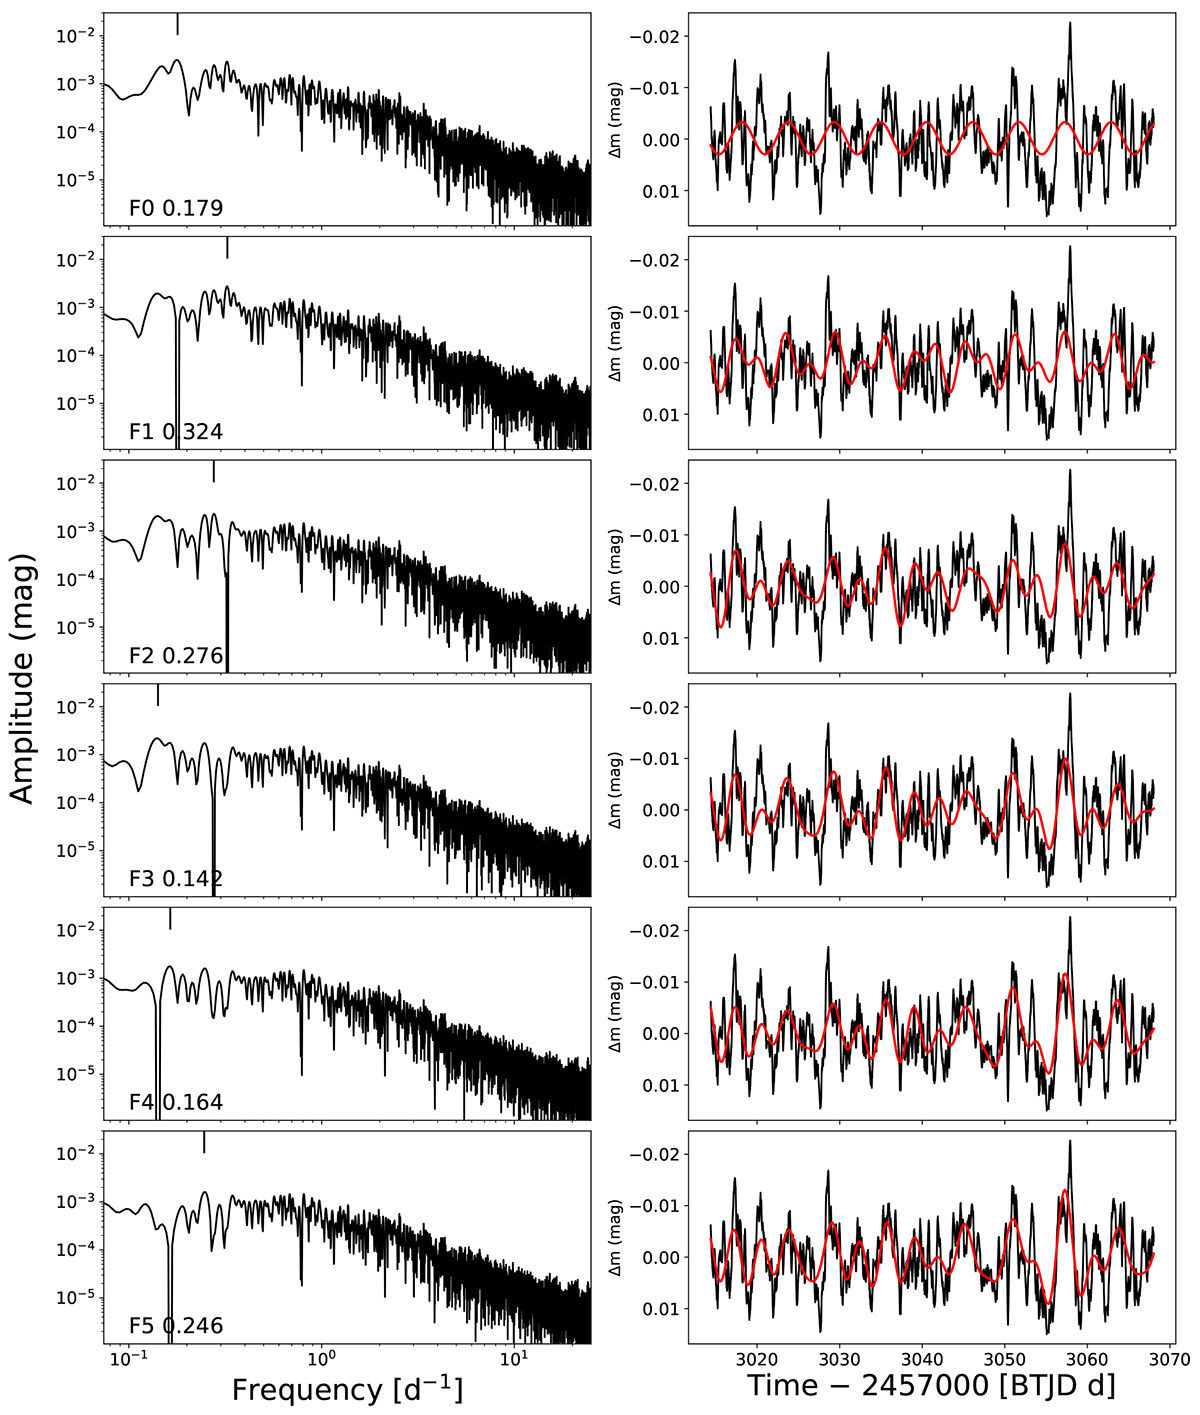
Iterative pre-whitening for the extraction of frequencies for HD 94493 (Sectors 63 and 64). Left: Calculated amplitude spectra (Lomb-Scargle periodograms) shown in logarithmic scale. A vertical line at the top of each panel points toward the extracted frequency, which is reported in the lower left. Right: Light curve of the star (black points) with the integrated fit model of sinusoidals superimposed (red).
Current usage metrics show cumulative count of Article Views (full-text article views including HTML views, PDF and ePub downloads, according to the available data) and Abstracts Views on Vision4Press platform.
Data correspond to usage on the plateform after 2015. The current usage metrics is available 48-96 hours after online publication and is updated daily on week days.
Initial download of the metrics may take a while.