Fig. 7.
Download original image
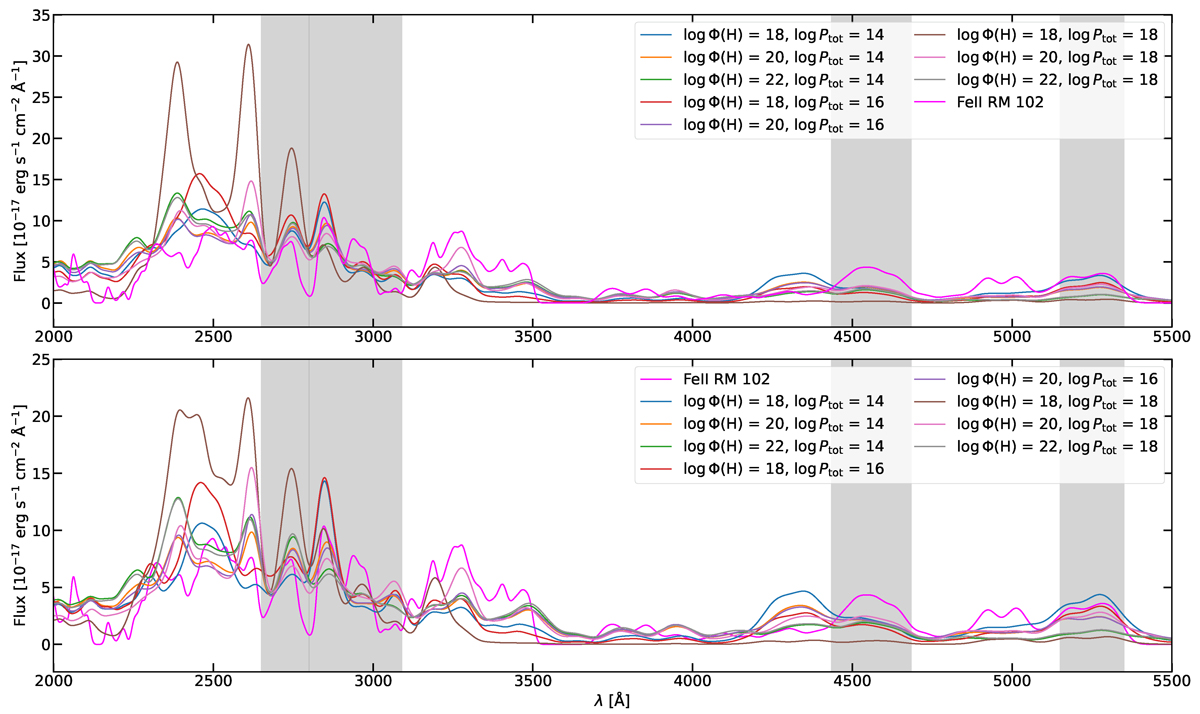
Top: Spectra of the Fe II emission obtained for several simulations in the Z = 20 Z⊙ and Vturb = 100 km s−1 grid. Grey-shaded regions indicate spectral ranges used to compute RUV and Ropt. Each template is normalized by the f parameter to match the integrated flux of the RM 102 spectrum in the 2000–5500 Å range. The figure demonstrates that no simulation accurately reproduces the observed Fe II emission across all grey-marked regions. Synthetic spectra are broadened using a Gaussian kernel with FWHM = 2500 km s−1. Bottom: Same as the top figure, but for 20% contribution from the bright side and 80% from the dark side.
Current usage metrics show cumulative count of Article Views (full-text article views including HTML views, PDF and ePub downloads, according to the available data) and Abstracts Views on Vision4Press platform.
Data correspond to usage on the plateform after 2015. The current usage metrics is available 48-96 hours after online publication and is updated daily on week days.
Initial download of the metrics may take a while.