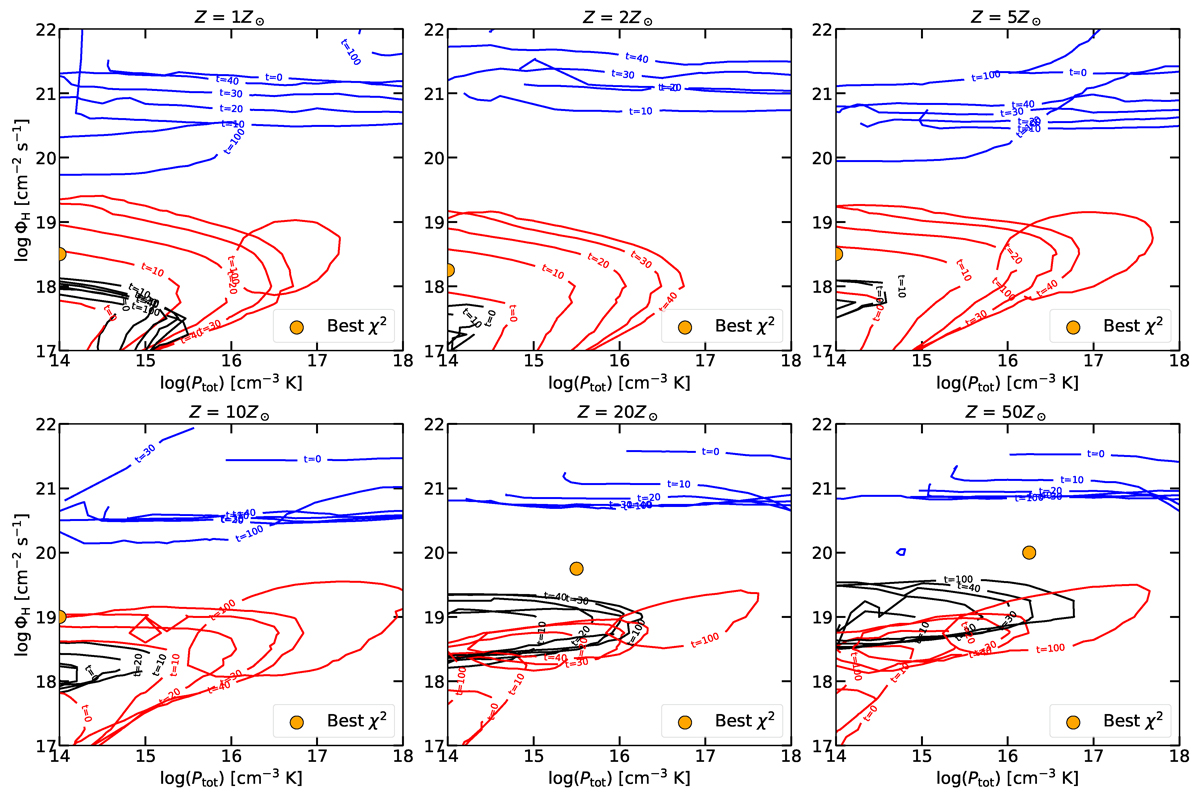
Fig. 5.
Download original image
Contour plots denoting the ratios observed in the source RM 102 for different values of metallicity and microturbulence, assuming 20% contribution from the bright side of the cloud and 80% from the dark side. The RUV−opt contours are shown in black, the RUV contours are shown in red, and the Ropt contours are shown in blue. The position associated with the best χ2 for each bin of metallicity is marked with an orange dot.
Current usage metrics show cumulative count of Article Views (full-text article views including HTML views, PDF and ePub downloads, according to the available data) and Abstracts Views on Vision4Press platform.
Data correspond to usage on the plateform after 2015. The current usage metrics is available 48-96 hours after online publication and is updated daily on week days.
Initial download of the metrics may take a while.