Fig. 2.
Download original image
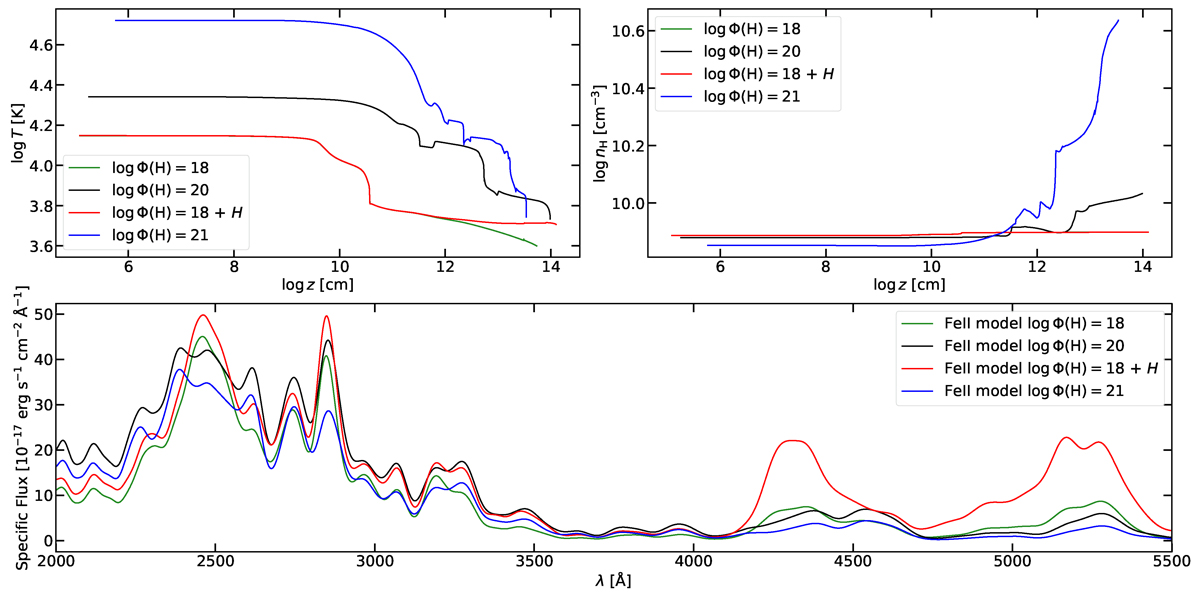
Structure and spectra of exemplary clouds simulated with CLOUDY at constant pressure, assuming log(Ptot) = 16 cm−3 K, Vturb = 100 km s−1, Nc = 1024 cm−2 and Z = 10 Z⊙. The assumed values of ionizing fluxes are logΦ(H) = 18 cm−2 s−1 (displayed in green), 20 cm−2 s−1 (black) and 21 cm−2 s−1 (blue). An additional example with logΦ(H) = 18 cm−2 s−1 and the addition of extra mechanical heating is displayed in red. Top left: Cloud temperature profile in logarithmic scale as a function of depth (z) of the cloud. Top right: Cloud density profile in logarithmic scale as a function of depth (z) of the cloud. Bottom: Spectra of Fe II emission from different models, displayed with 100% covering factor. Each synthetic spectrum is broadened with a Gaussian kernel with FWHM = 2500 km s−1.
Current usage metrics show cumulative count of Article Views (full-text article views including HTML views, PDF and ePub downloads, according to the available data) and Abstracts Views on Vision4Press platform.
Data correspond to usage on the plateform after 2015. The current usage metrics is available 48-96 hours after online publication and is updated daily on week days.
Initial download of the metrics may take a while.