Fig. 1.
Download original image
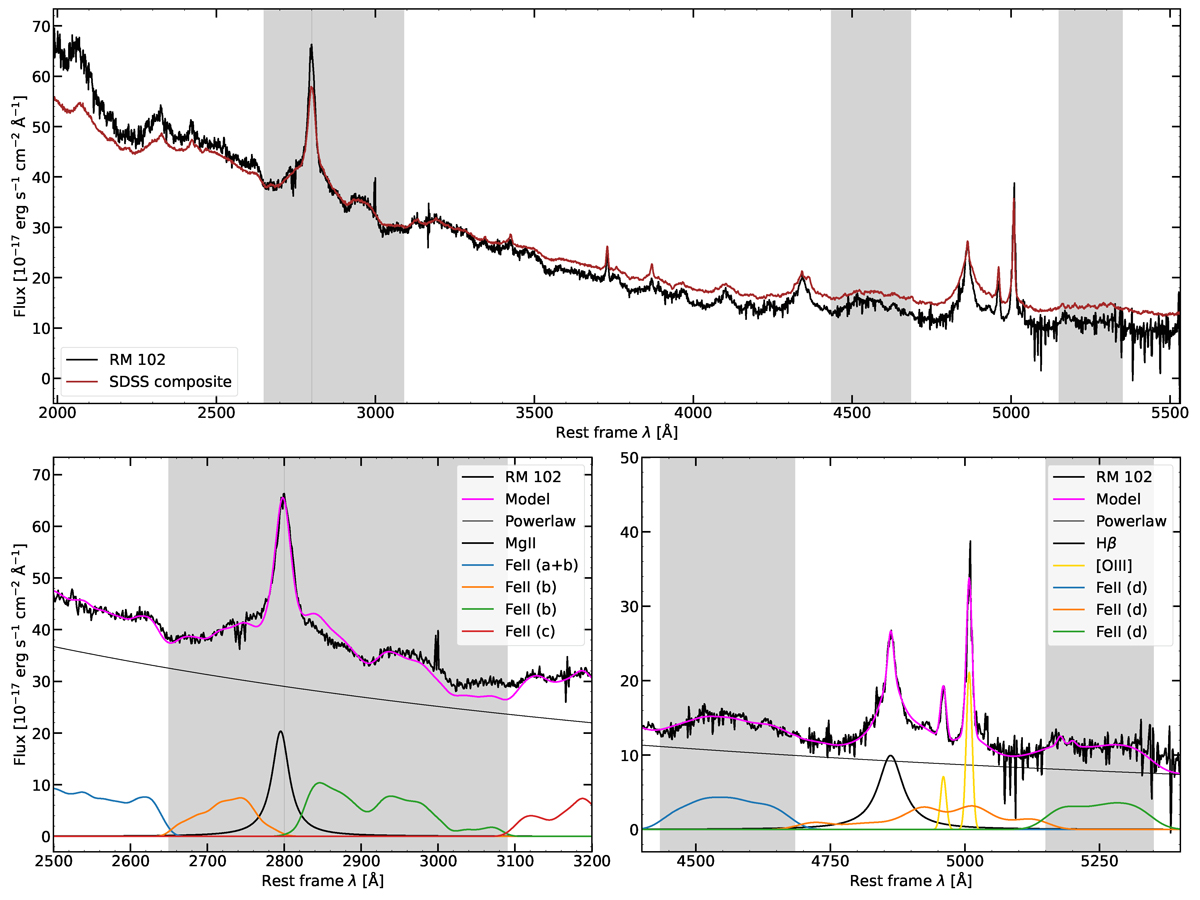
Top: Observed spectrum of RM 102, superimposed with the SDSS composite spectrum from Vanden Berk et al. (2001). The grey shaded regions define the spectral ranges from which the Fe II emission is extracted for the red-to-blue wings ratios in the UV and optical ranges (See Sect. 3.3). The SDSS composite is normalized at λ2800 Å. Bottom left: Zoomed-in on the UV Fe II emission, outlining the different spectral components adopted during fitting. Different Fe II templates (See Table 2 for reference) are displayed in different colours. Bottom right: Zoomed-in on the optical Fe II emission, outlining the different spectral components adopted during fitting, with the various Fe II templates (See Table 2 for reference) highlighted in different colours.
Current usage metrics show cumulative count of Article Views (full-text article views including HTML views, PDF and ePub downloads, according to the available data) and Abstracts Views on Vision4Press platform.
Data correspond to usage on the plateform after 2015. The current usage metrics is available 48-96 hours after online publication and is updated daily on week days.
Initial download of the metrics may take a while.