Fig. 6
Download original image
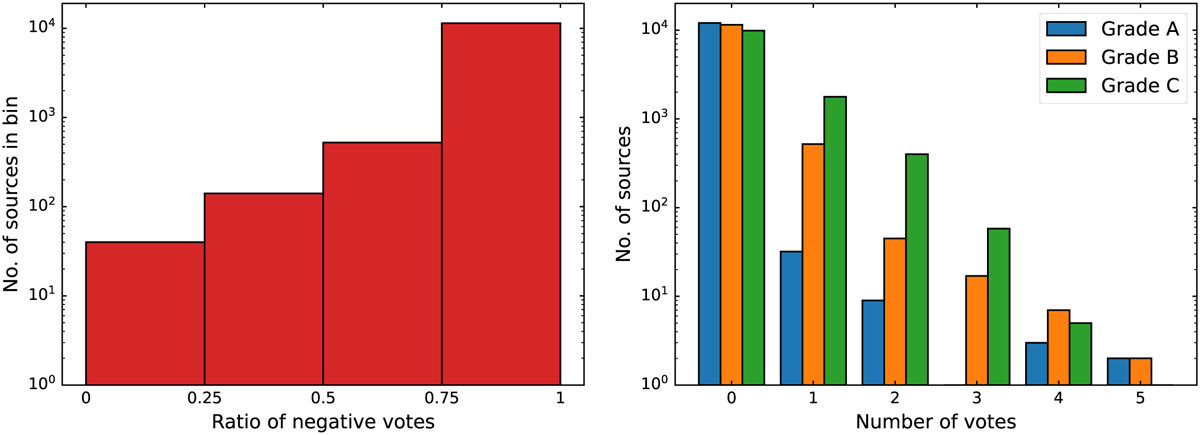
Results from Team 2 during the first stage. Left: histogram of the ratio of negative votes versus the total number of classifications for the source. The sources with a ratio of negative votes lower than 0.5 were selected for stage 2. Right: total number of sources that received a given number of votes for a given classification. Most of the sources had zero votes for A, B, and C. All sources with at least one vote for A or B were also selected for stage 2.
Current usage metrics show cumulative count of Article Views (full-text article views including HTML views, PDF and ePub downloads, according to the available data) and Abstracts Views on Vision4Press platform.
Data correspond to usage on the plateform after 2015. The current usage metrics is available 48-96 hours after online publication and is updated daily on week days.
Initial download of the metrics may take a while.