Fig. B.1
Download original image
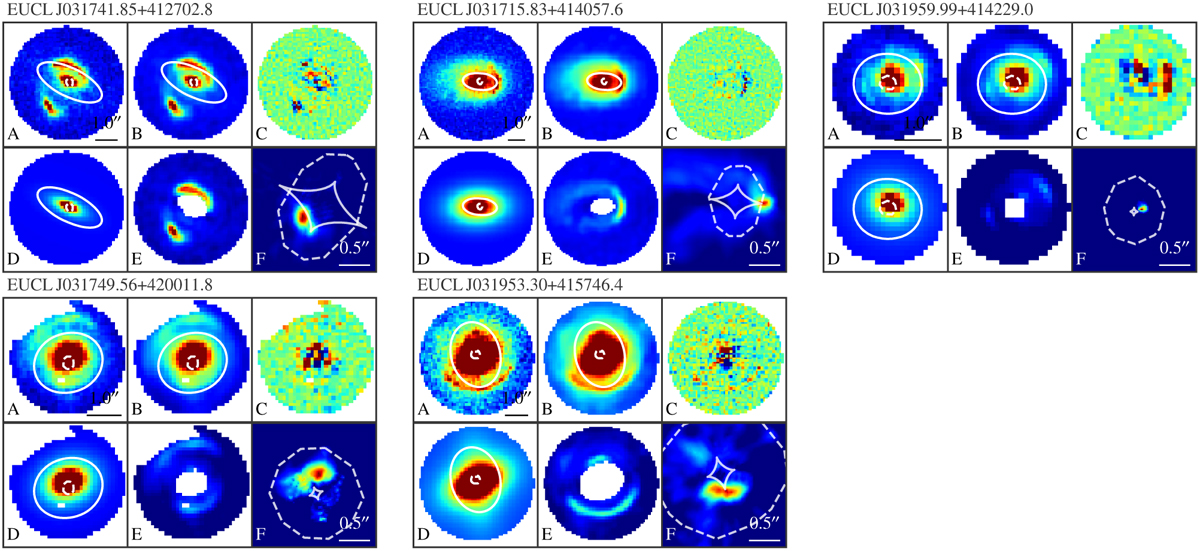
Modelling results for all five of the candidates that have valid lens models. Panels (A): VIS cutout data, masked to a circle around the object. Panels (B): Model lens light and lensed source light distributions, convolved with the point spread function model. Panels (C): Normalised residuals on a colour scale between −3 σ and 3 σ. Panels (D): Lens light only. Panels (E): Lensed source light only, with the brightest parts of the lens light masked. Panels (F): Reconstructed source plane model. The solid and dashed white ellipses in the image planes are the tangential and radial critical curves, with the corresponding caustics shown in the source plane. The image plane frames all have the same scale, which is indicated in the first frame.
Current usage metrics show cumulative count of Article Views (full-text article views including HTML views, PDF and ePub downloads, according to the available data) and Abstracts Views on Vision4Press platform.
Data correspond to usage on the plateform after 2015. The current usage metrics is available 48-96 hours after online publication and is updated daily on week days.
Initial download of the metrics may take a while.