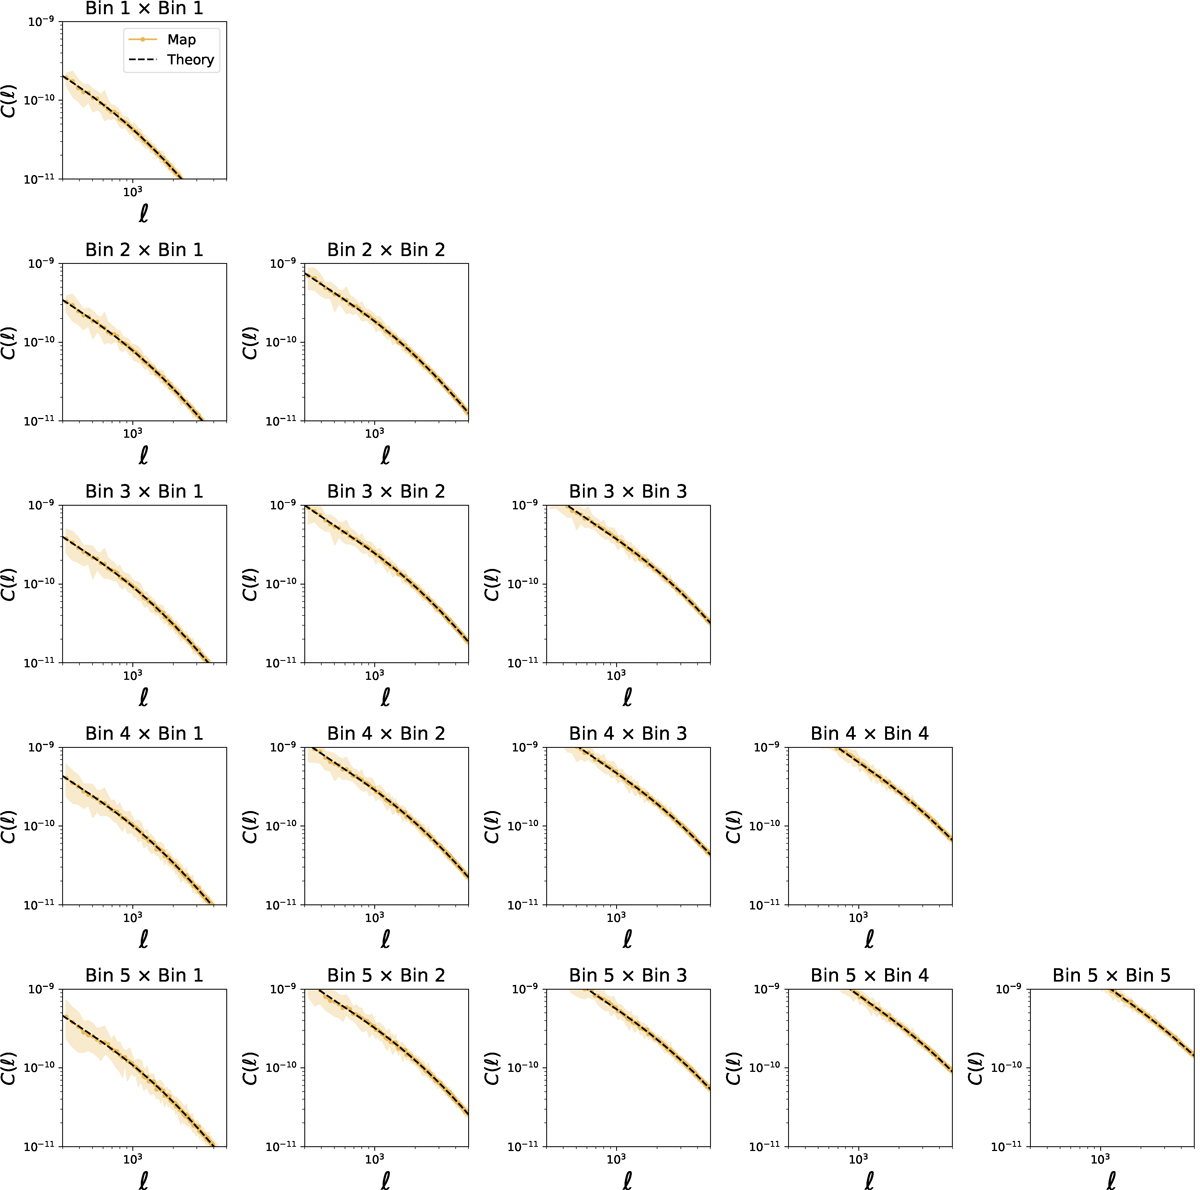
Fig. D.1.
Download original image
Convergence power spectra for different tomographic bin combinations. The solid yellow line shows the measurement from 20 simulated maps using the survey setting described in section 4, while the black dashed line shows the theoretical predictions computed using jax-cosmo. In this figure, the shaded regions represent the standard deviation from 20 independent map realizations.
Current usage metrics show cumulative count of Article Views (full-text article views including HTML views, PDF and ePub downloads, according to the available data) and Abstracts Views on Vision4Press platform.
Data correspond to usage on the plateform after 2015. The current usage metrics is available 48-96 hours after online publication and is updated daily on week days.
Initial download of the metrics may take a while.