Fig. 5.

Download original image
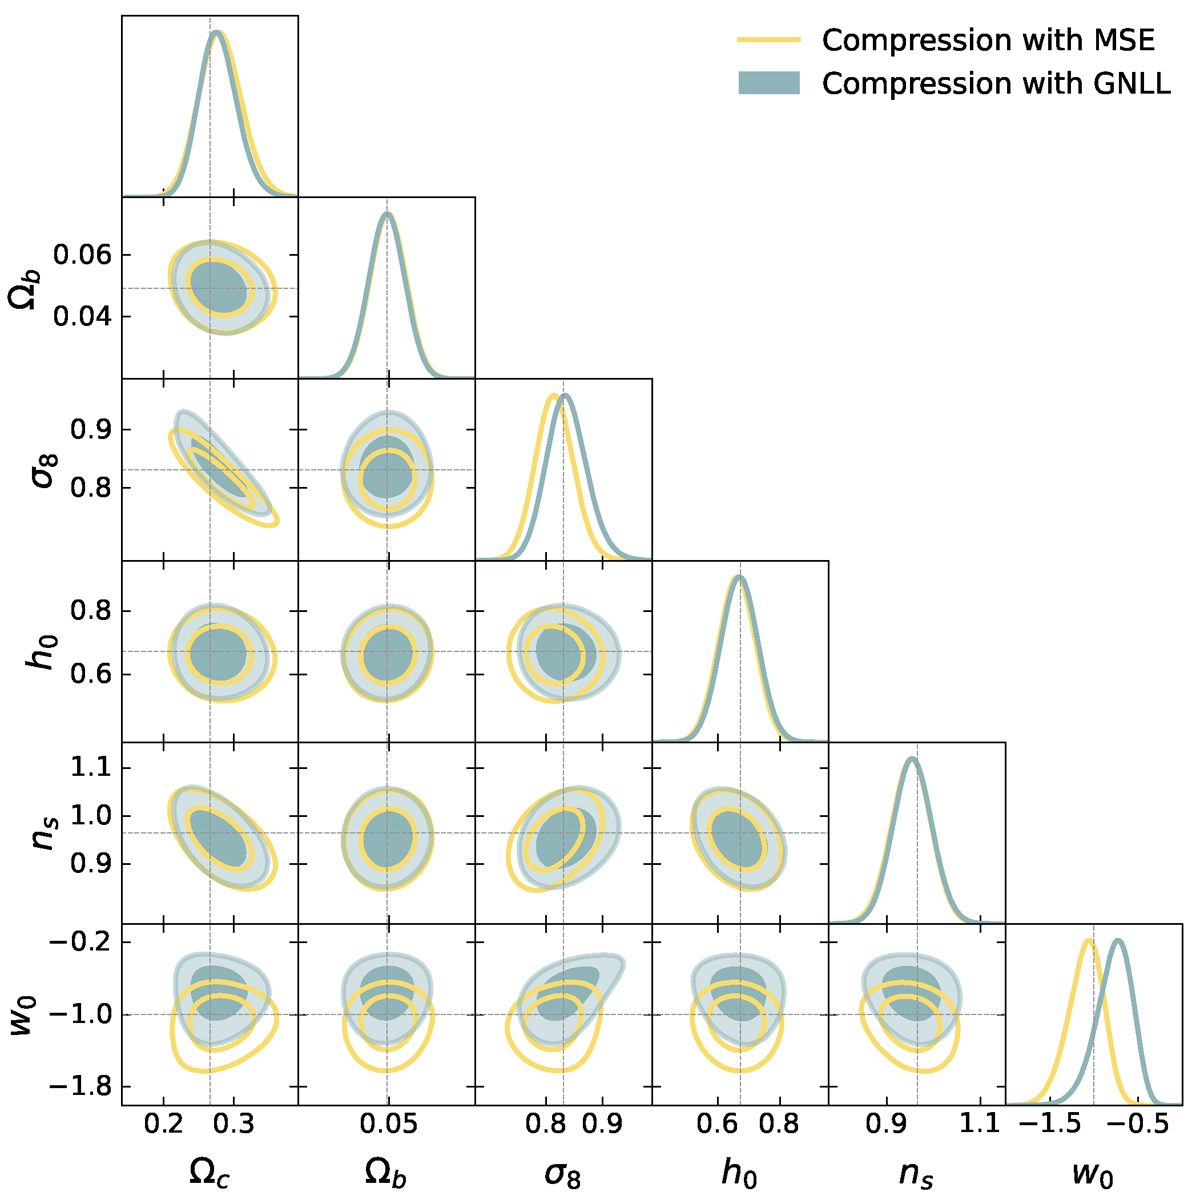
Constraints on the wCDM parameter space as found in the LSST Y10 survey setup. We compare the constraints obtained with the GNLL compression (green contours) and MSE compression (yellow contours). These two compressions are supposed to yield the same constraints. The difference is due to optimization issues while training using the GNLL loss function. The same implicit inference procedure is used to get the approximated posterior from these two different compressed data. The contours show the 68% and the 95% confidence regions. The dashed lines define the true parameter values.
Current usage metrics show cumulative count of Article Views (full-text article views including HTML views, PDF and ePub downloads, according to the available data) and Abstracts Views on Vision4Press platform.
Data correspond to usage on the plateform after 2015. The current usage metrics is available 48-96 hours after online publication and is updated daily on week days.
Initial download of the metrics may take a while.


