Fig. 46
Download original image
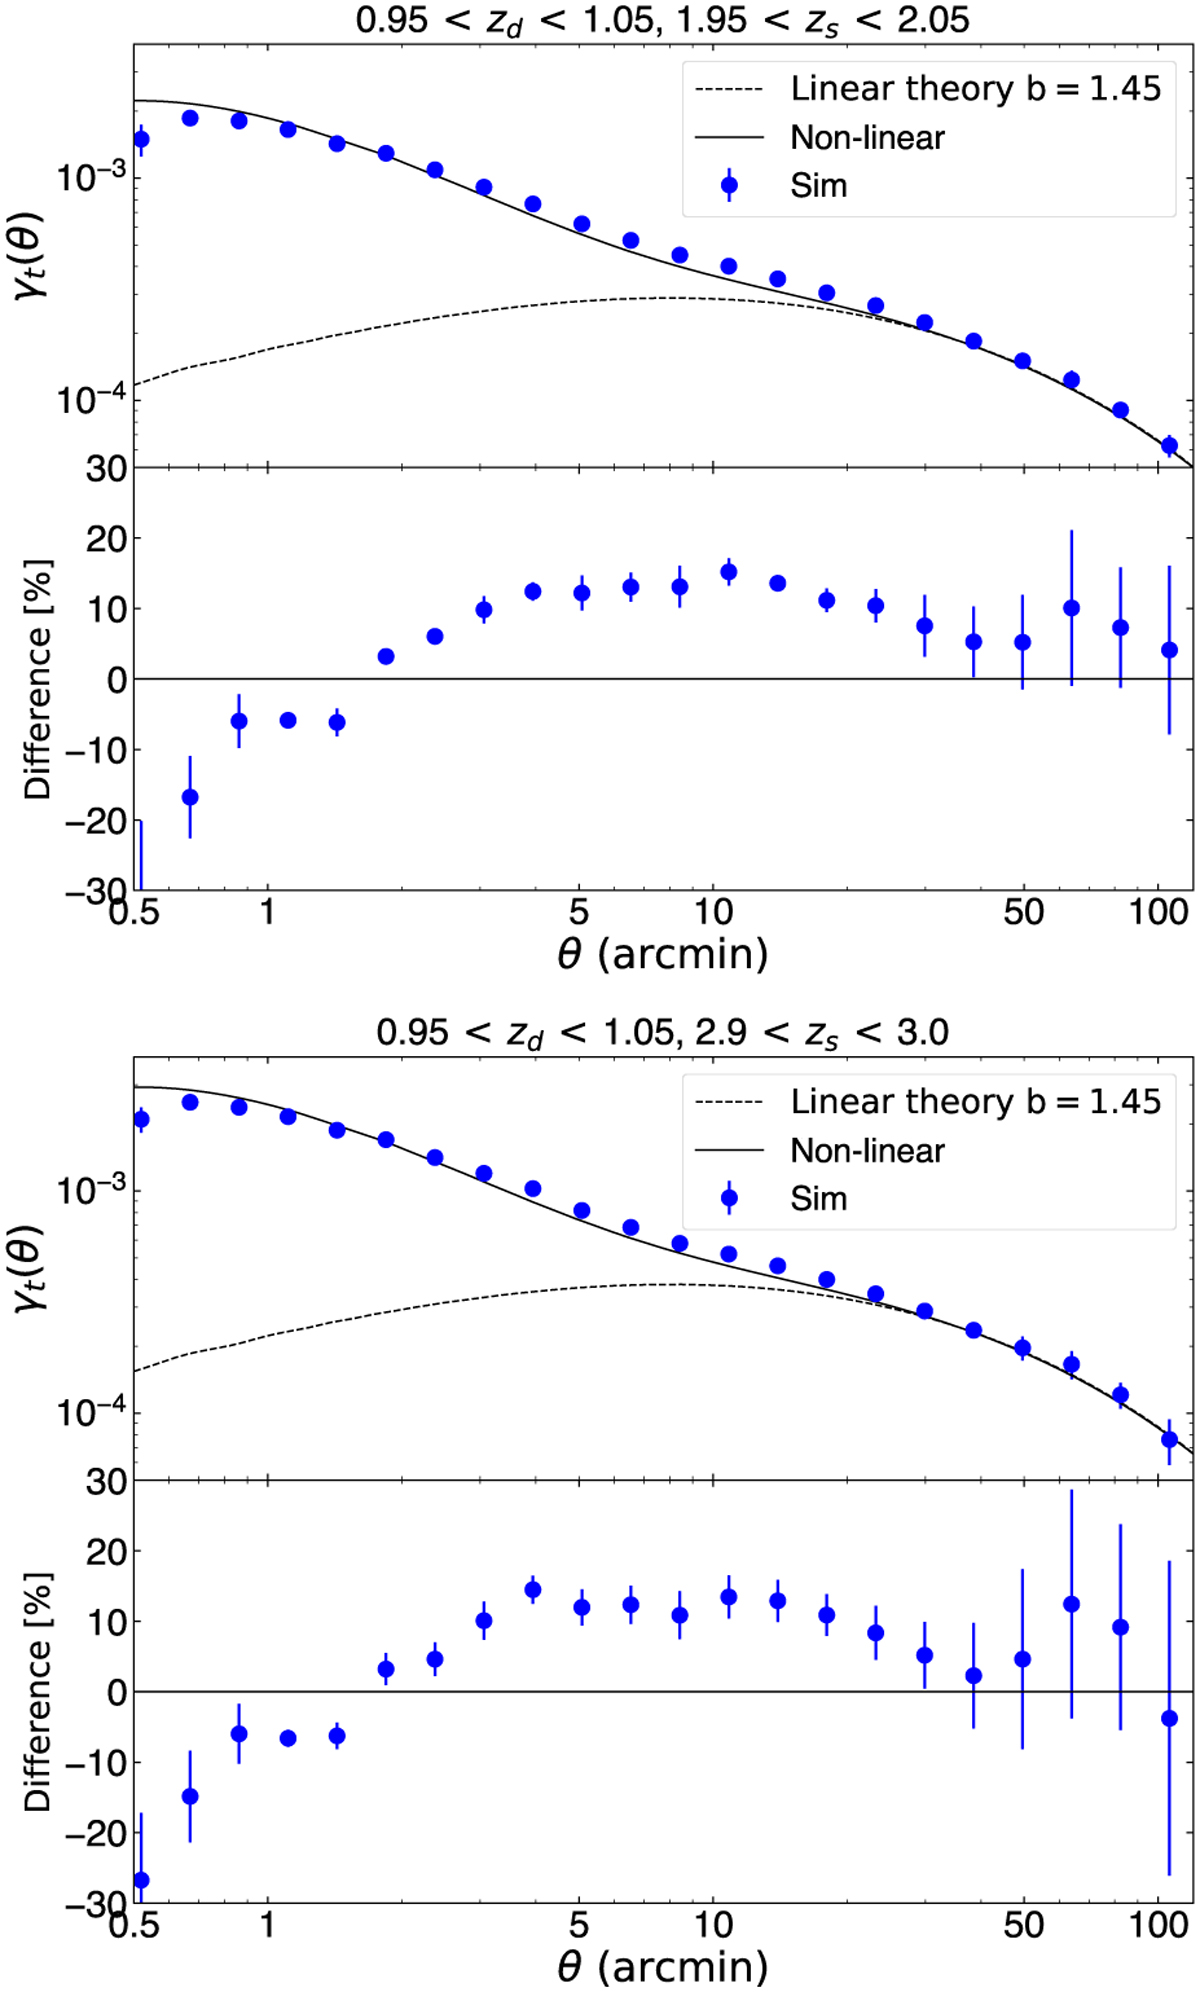
Galaxy-galaxy lensing: cross-correlations between lens positions and source shear for different source redshift planes (ɀs ≃ 2 in the top panel, and ɀs ≃ 3 in the bottom panel, respectively) at fixed lens (deflector) redshift, ɀd ≃ 1. Simulation measurements (filled blue circles) are compared to linear and nonlinear theory predictions (lines). Lower panels show fractional differences between simulation and nonlinear theory.
Current usage metrics show cumulative count of Article Views (full-text article views including HTML views, PDF and ePub downloads, according to the available data) and Abstracts Views on Vision4Press platform.
Data correspond to usage on the plateform after 2015. The current usage metrics is available 48-96 hours after online publication and is updated daily on week days.
Initial download of the metrics may take a while.