Fig. 43
Download original image
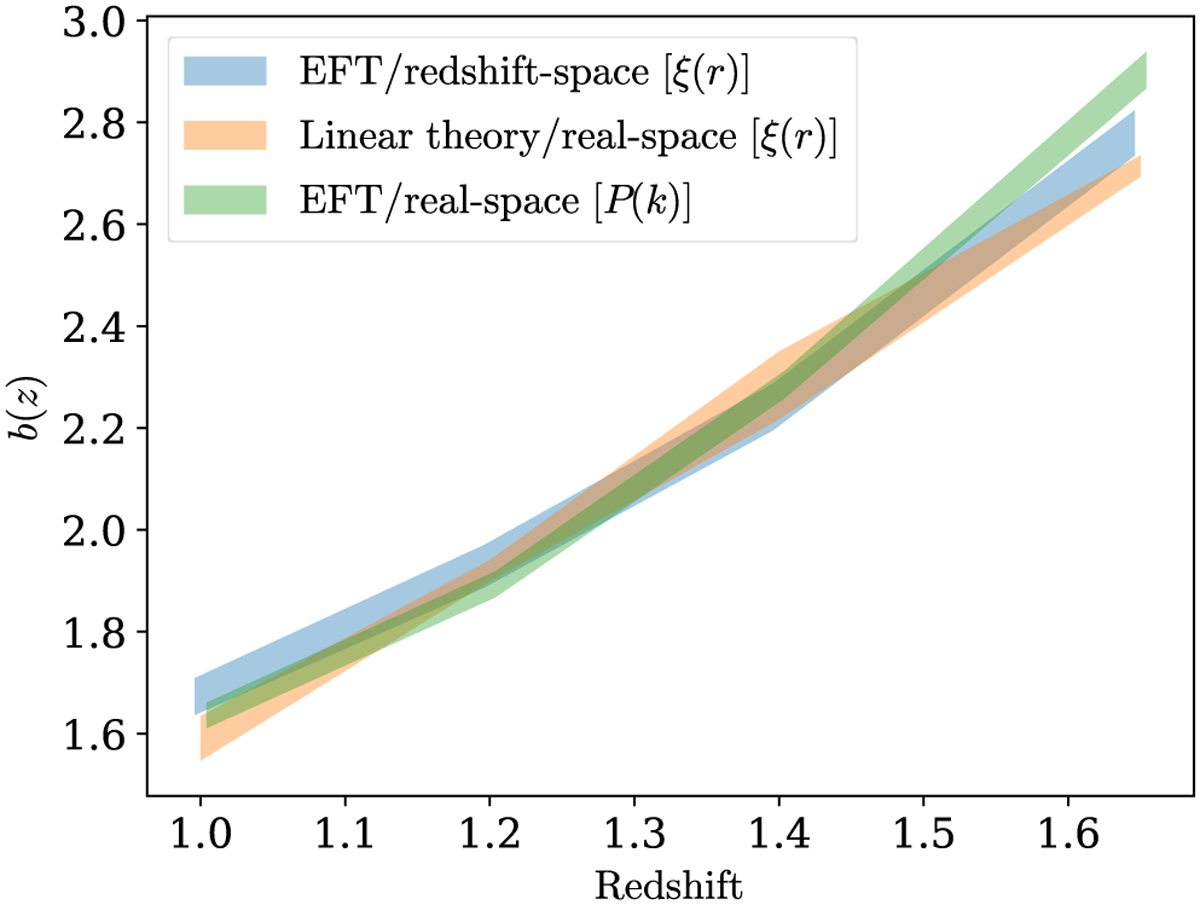
Linear galaxy bias, b1, as a function of redshift for Hα emitters in the Flagship simulation. In blue we show the estimation from the fit to the two-point correlation function multipoles in redshift space using the EFT model. In orange, we use linear theory in real space to fit the correlation function monopole. Finally, in green we fit the real- space monopole of the power spectrum using EFT at one-loop order. The colour bands show the 1 σ confidence regions of the linear bias.
Current usage metrics show cumulative count of Article Views (full-text article views including HTML views, PDF and ePub downloads, according to the available data) and Abstracts Views on Vision4Press platform.
Data correspond to usage on the plateform after 2015. The current usage metrics is available 48-96 hours after online publication and is updated daily on week days.
Initial download of the metrics may take a while.