Fig. 37
Download original image
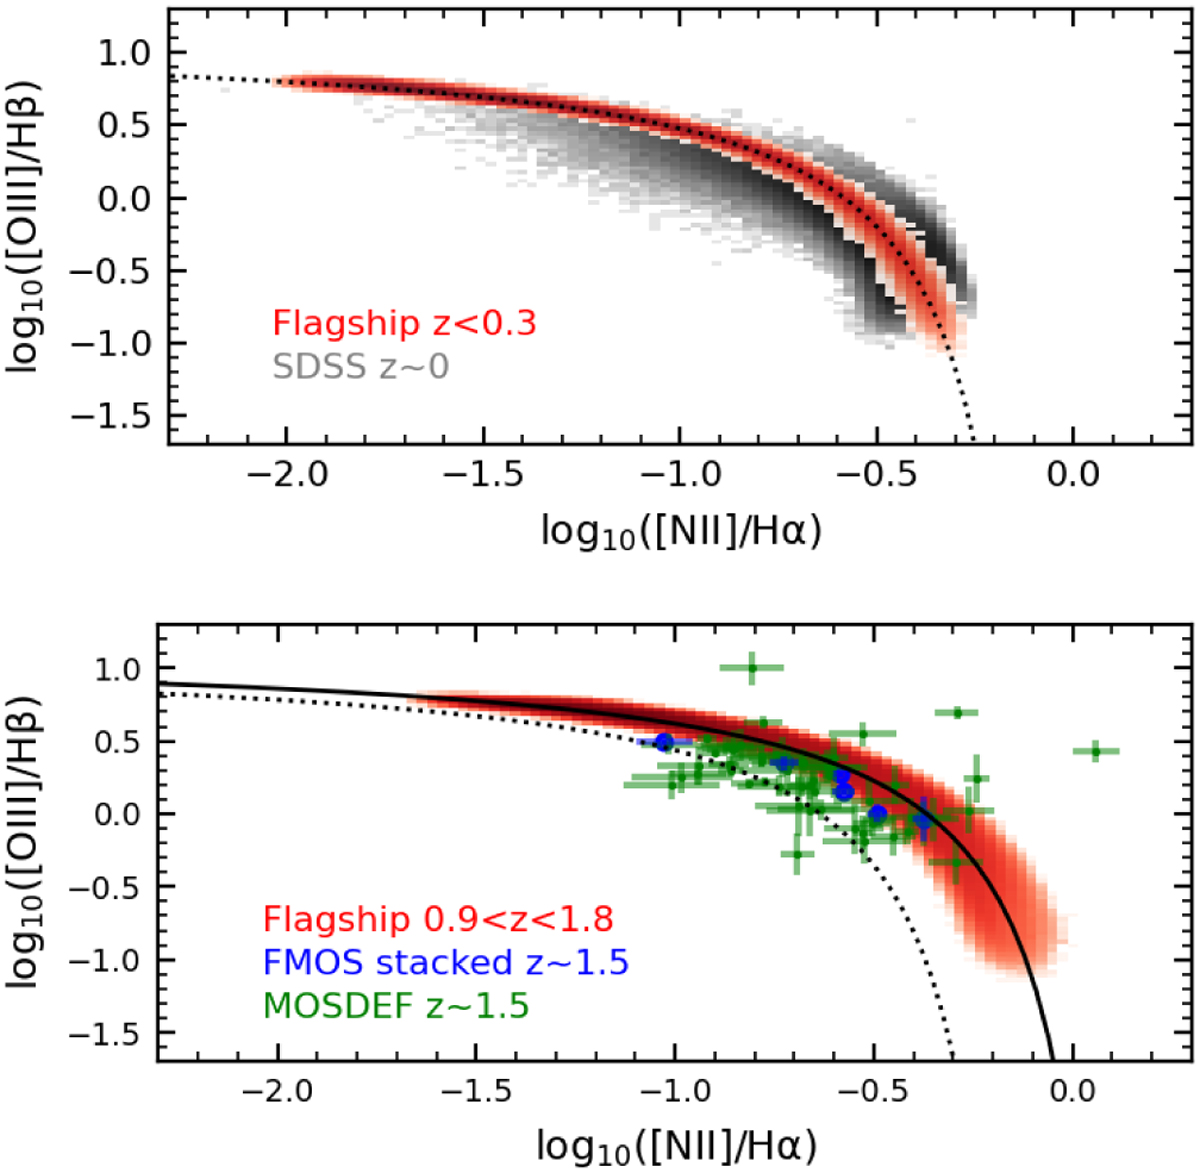
BPT diagram. Top panel: emission line ratios in the redshift range z < 0.5 for Flagship (red colour map) compared to SDSS (in grey) main target sample for objects classified as galaxies. Bottom panel: emission line ratio in the redshift range 0.9 < z < 1.8 compared to FMOS stacked data in COSMOS at z ~ 1.5 from Kashino et al. (2019) and MOSFDEF data from Kriek et al. (2015) and Reddy et al. (2015). The black lines are the relations by Kewley et al. (2013a) at z ~ 0 (dotted lines) and z ~ 1.5 (solid lines).
Current usage metrics show cumulative count of Article Views (full-text article views including HTML views, PDF and ePub downloads, according to the available data) and Abstracts Views on Vision4Press platform.
Data correspond to usage on the plateform after 2015. The current usage metrics is available 48-96 hours after online publication and is updated daily on week days.
Initial download of the metrics may take a while.