Open Access
Fig. 30
Download original image
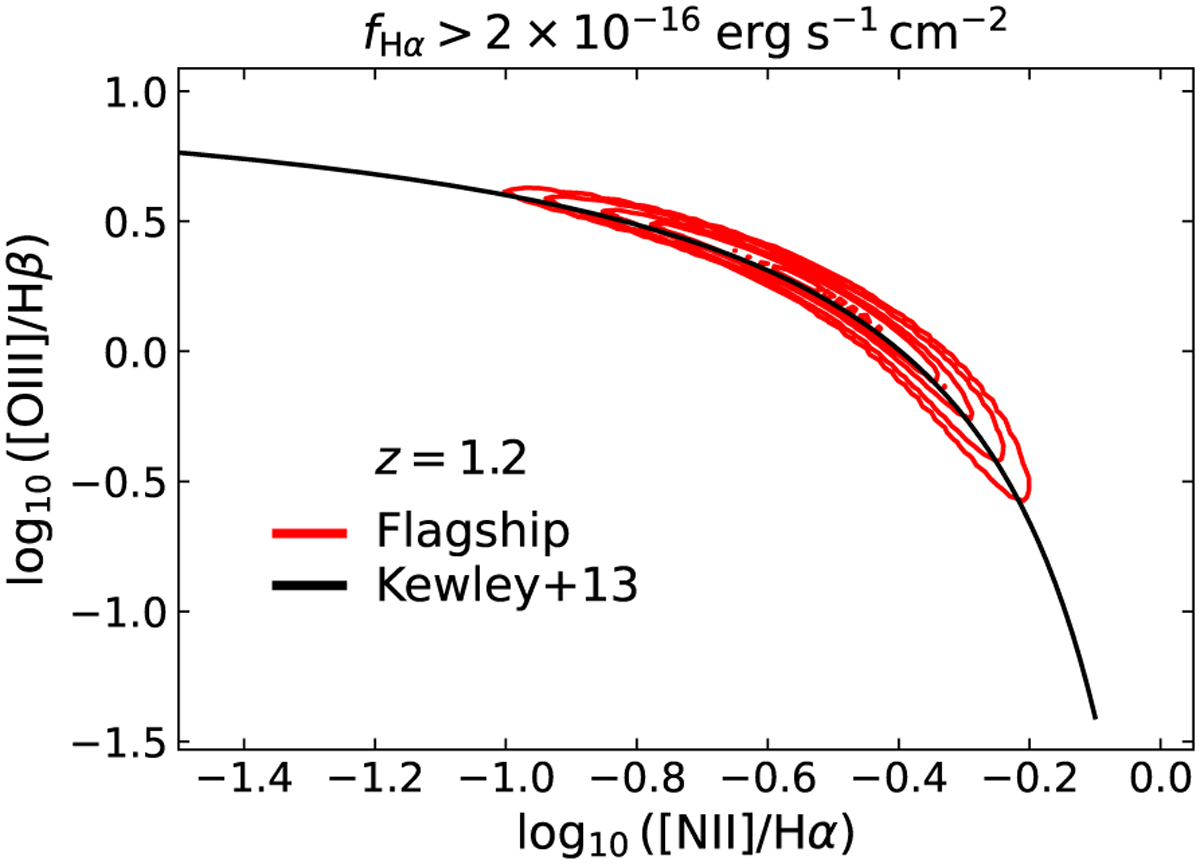
BPT diagram at z = 1.20. The red contours show the density of Flagship galaxies selected with the standard Euclid galaxy clustering sample Hα flux limit of fHα = 2 × 10⁻¹⁶ erg s−1 cm−2 in this diagram. The black solid line is the relation of Kewley et al. (2013a) for this redshift.
Current usage metrics show cumulative count of Article Views (full-text article views including HTML views, PDF and ePub downloads, according to the available data) and Abstracts Views on Vision4Press platform.
Data correspond to usage on the plateform after 2015. The current usage metrics is available 48-96 hours after online publication and is updated daily on week days.
Initial download of the metrics may take a while.