Fig. 12
Download original image
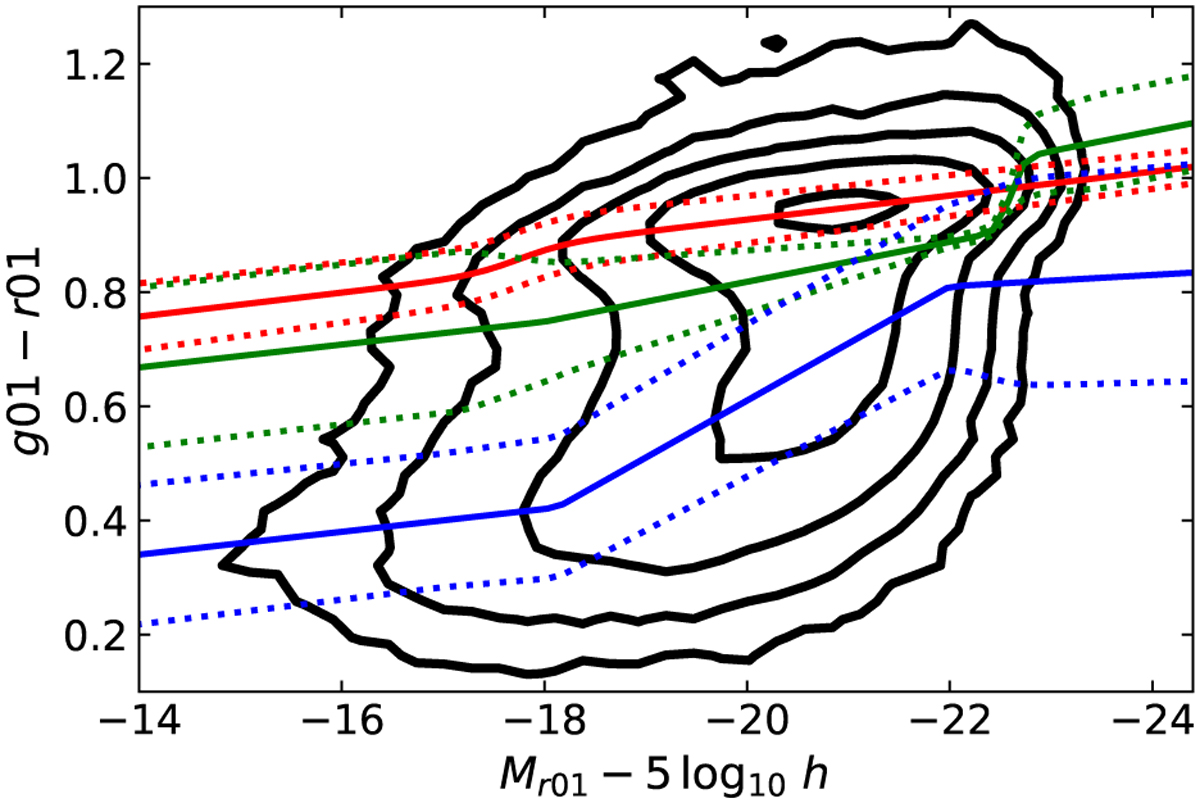
Colour-magnitude diagram of the SDSS NYU-VAGC (Blanton et al. 2005a). The black lines show contours of the same density of galaxies in this space. The red, green, and blue solid lines show the mean of the distributions of the three Gaussian fits to the (g01 − r01) colour distributions as a function of absolute magnitude. The dotted lines show the position of the mean ± the standard deviation of the Gaussian distributions.
Current usage metrics show cumulative count of Article Views (full-text article views including HTML views, PDF and ePub downloads, according to the available data) and Abstracts Views on Vision4Press platform.
Data correspond to usage on the plateform after 2015. The current usage metrics is available 48-96 hours after online publication and is updated daily on week days.
Initial download of the metrics may take a while.