Fig. 7
Download original image
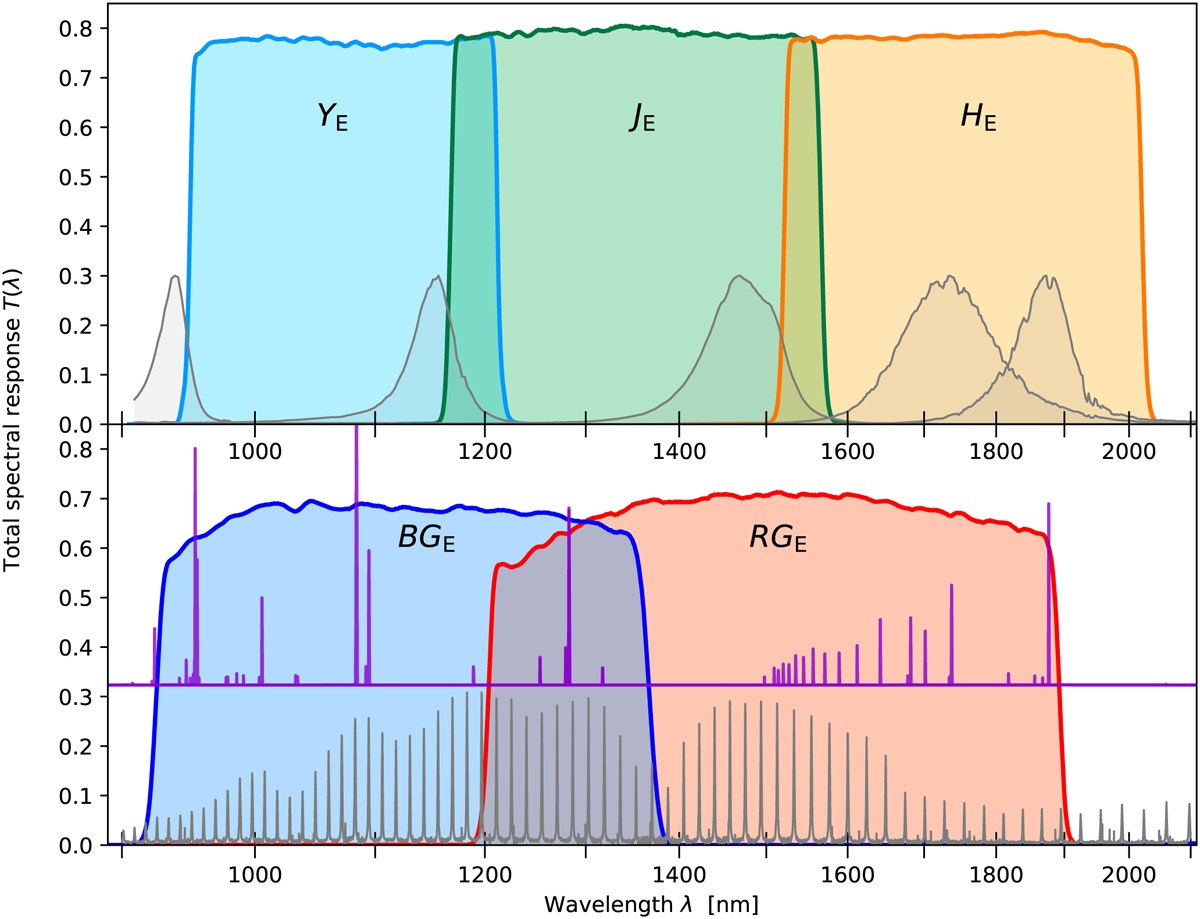
Total spectral response curves, accounting for mirrors, the dichroic element, all optical elements in NISP, and the detectors’ mean quantum efficiency. Top panel: three filter passbands shown together with the approximate emission curves of the five calibration lamps. Bottom panel: blue and red spectral passbands for the first order. The etalon spectrum used for wavelength calibration on ground is overlaid as the grey curve at the bottom. The log-scaled spectrum of one of our compact planetary nebulae for in-flight wavelength calibration is shown in purple (Euclid Collaboration: Paterson et al. 2023). All calibrator spectra are arbitrarily scaled in this figure.
Current usage metrics show cumulative count of Article Views (full-text article views including HTML views, PDF and ePub downloads, according to the available data) and Abstracts Views on Vision4Press platform.
Data correspond to usage on the plateform after 2015. The current usage metrics is available 48-96 hours after online publication and is updated daily on week days.
Initial download of the metrics may take a while.