Fig. 5

Download original image
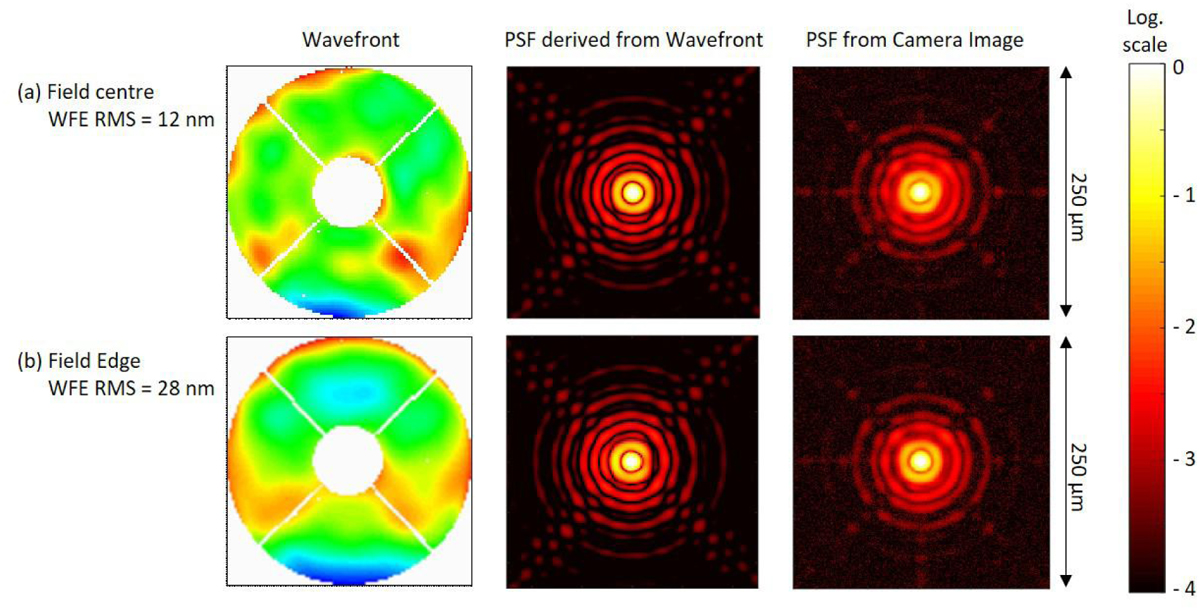
Optical performance of NI-OA at λ = 960 nm determined at two positions corresponding to the field centre (top row) and a corner of the NISP field of view (bottom row). The wavefront maps in the first column are based on a Shack-Hartmann sensor measurement, the PSFs in the second column are derived from these wavefronts, and the PSFs in the third column are directly observed with a CCD camera. We note that the logarithmic scale is over four orders of magnitude.
Current usage metrics show cumulative count of Article Views (full-text article views including HTML views, PDF and ePub downloads, according to the available data) and Abstracts Views on Vision4Press platform.
Data correspond to usage on the plateform after 2015. The current usage metrics is available 48-96 hours after online publication and is updated daily on week days.
Initial download of the metrics may take a while.


