Fig. 18
Download original image
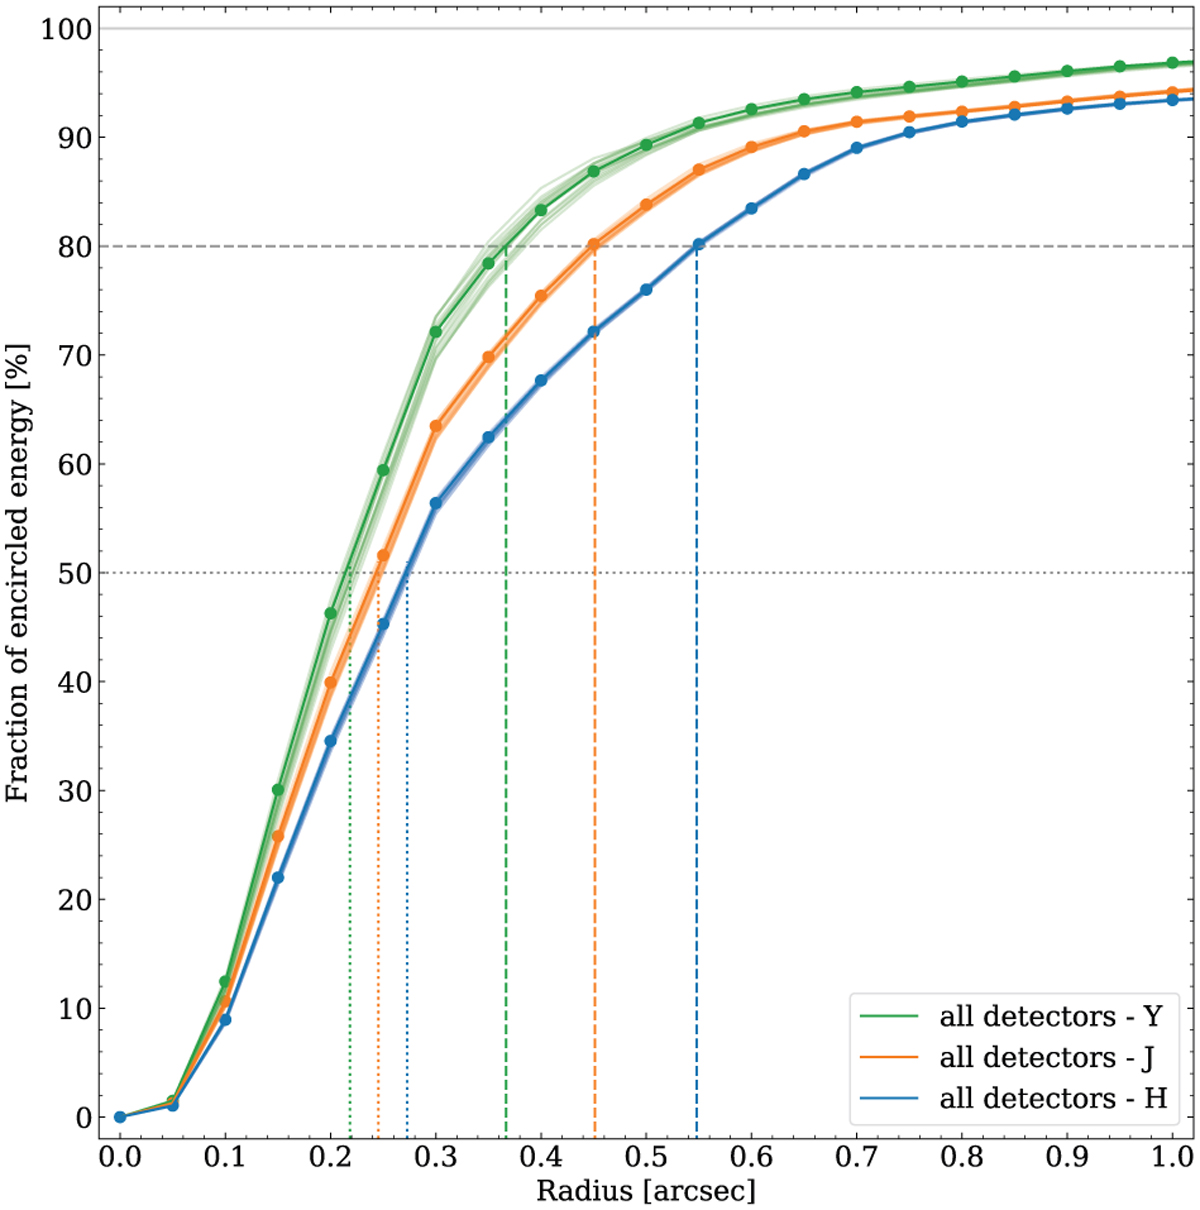
Modelled encircled energy (EE) of the Euclid NISP PSF in the three photometry channels from data observed in the self-calibration field during the PV phase and based on simplified PSF models. Shown is the cumulative EE of point sources as a function of radius from the objects’ centre. The three colours are curves for the YE-band (green), JE-band (orange), and HE-band (blue). For each passband there is one line for each of the 16 detectors in the FPA, in each case describing the mean detector EE curve – which is very similar for all detectors – and an overall average. Vertical lines mark the radius encircling 50% (rEE50) and 80% (rEE80) of the total flux.
Current usage metrics show cumulative count of Article Views (full-text article views including HTML views, PDF and ePub downloads, according to the available data) and Abstracts Views on Vision4Press platform.
Data correspond to usage on the plateform after 2015. The current usage metrics is available 48-96 hours after online publication and is updated daily on week days.
Initial download of the metrics may take a while.