Fig. 9
Download original image
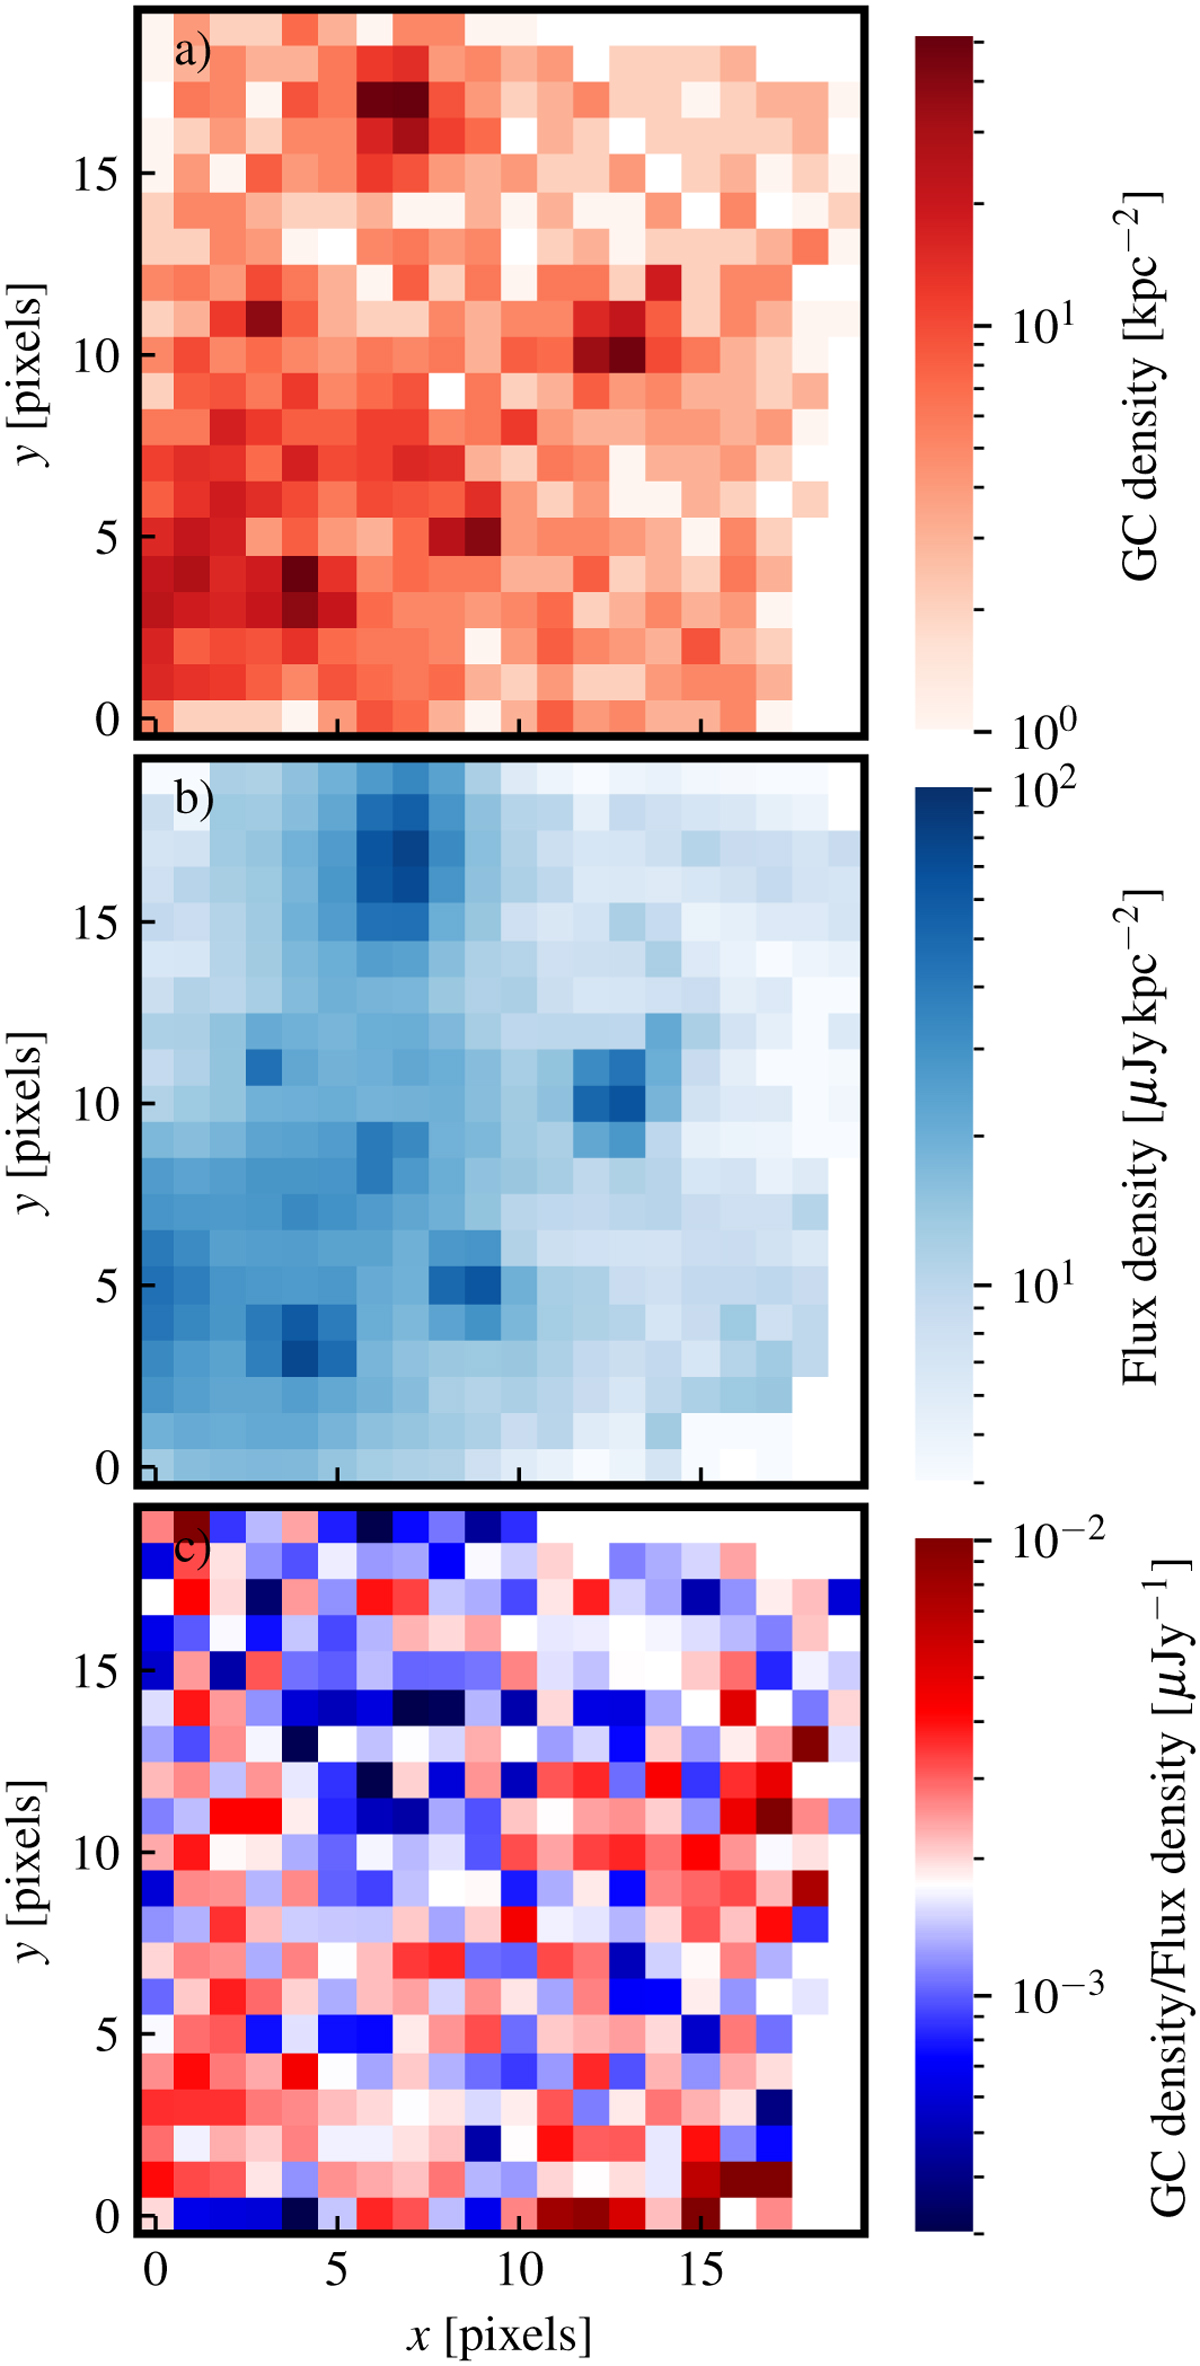
2D maps of GC density, flux density, and the ratio between them across the FoV: (a) GC density in the Fornax FoV binned into a 20 × 20 grid, (b) flux density of diffuse light within the same cells as panel (a), with all bright galaxies and other bright sources masked, (c) ratio between the GC density and the flux density of the diffuse light. The colour-bar on the left corresponds to the ratios shown in this panel.
Current usage metrics show cumulative count of Article Views (full-text article views including HTML views, PDF and ePub downloads, according to the available data) and Abstracts Views on Vision4Press platform.
Data correspond to usage on the plateform after 2015. The current usage metrics is available 48-96 hours after online publication and is updated daily on week days.
Initial download of the metrics may take a while.