Fig. 8
Download original image
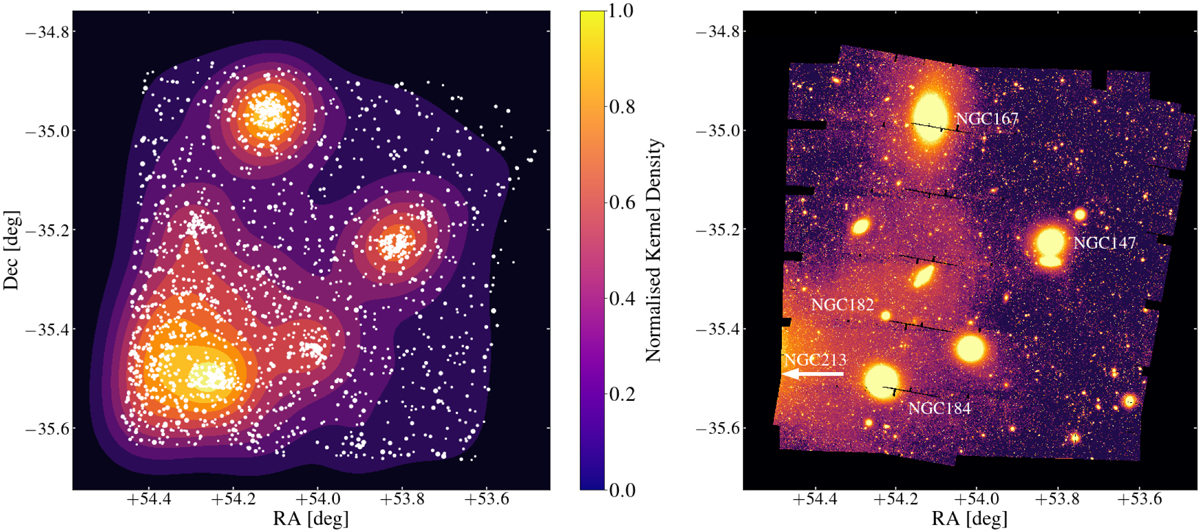
Projected distribution and density map of GC candidates (white points) brighter than IE = 23.5 (left panel) versus the diffuse light in IE (background image in the right panel) in the ERO-F field of view in the Fornax cluster. In the left panel, the size of the white points (GC candidates) corresponds to the total magnitude of GC candidates (brighter GCs appear larger). In the right panel, the smoothed version of the ERO-F data made from four exposures is shown. This is a different stack than the stacked frame used for the GC selection (which is made from two exposures with the best PSF). The black lines within the image are regions without any available data.
Current usage metrics show cumulative count of Article Views (full-text article views including HTML views, PDF and ePub downloads, according to the available data) and Abstracts Views on Vision4Press platform.
Data correspond to usage on the plateform after 2015. The current usage metrics is available 48-96 hours after online publication and is updated daily on week days.
Initial download of the metrics may take a while.