Fig. 7
Download original image
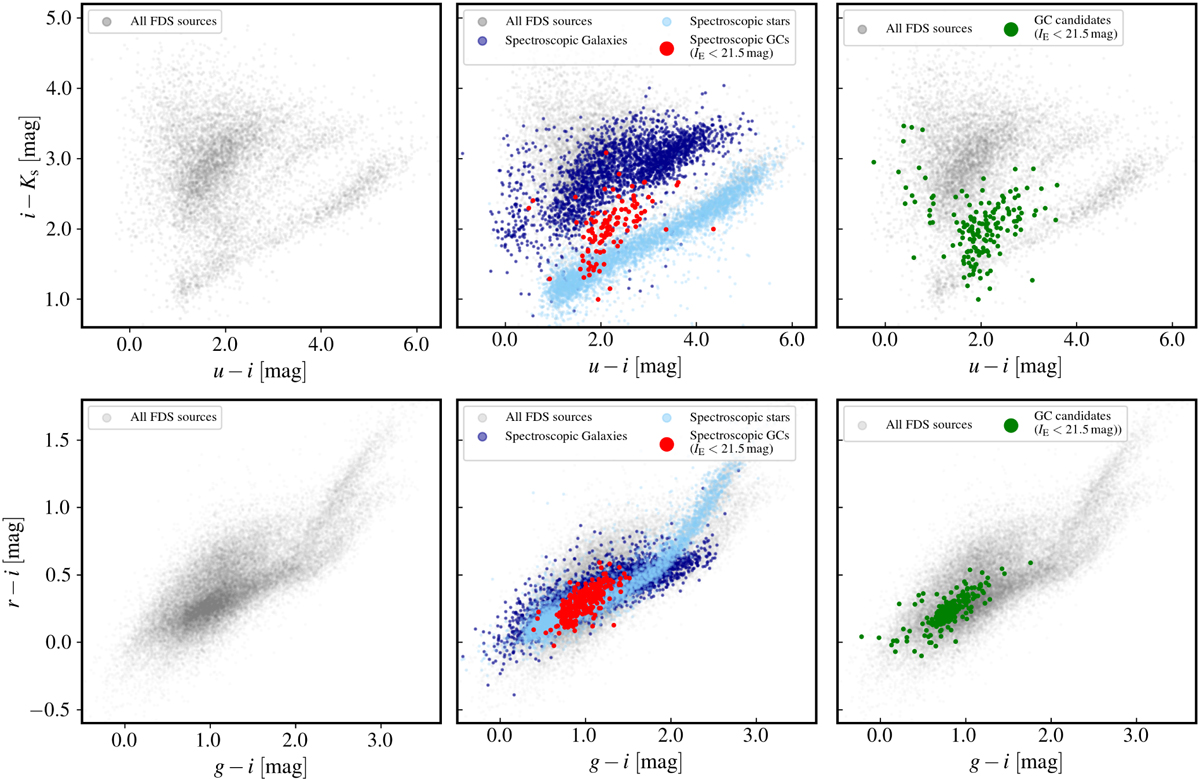
Colour-colour diagrams showing uiKs (upper panel) and gri (lower panel) for the detected sources in ERO-F data (grey points), using the photometry of the Fornax Deep Survey (FDS, Peletier et al. 2020) provided in Saifollahi et al. (2021a). GCs (red points) are known to show a well-defined sequence in uiKs separated from stars, except those at the bluest end (light blue points), and from galaxies (dark blue points). More than 90% of the bright GC candidates with IE < 21.5 (green points) selected in this work are located on this diagram, while less than 10% are consistent with being a foreground star or background galaxy.
Current usage metrics show cumulative count of Article Views (full-text article views including HTML views, PDF and ePub downloads, according to the available data) and Abstracts Views on Vision4Press platform.
Data correspond to usage on the plateform after 2015. The current usage metrics is available 48-96 hours after online publication and is updated daily on week days.
Initial download of the metrics may take a while.