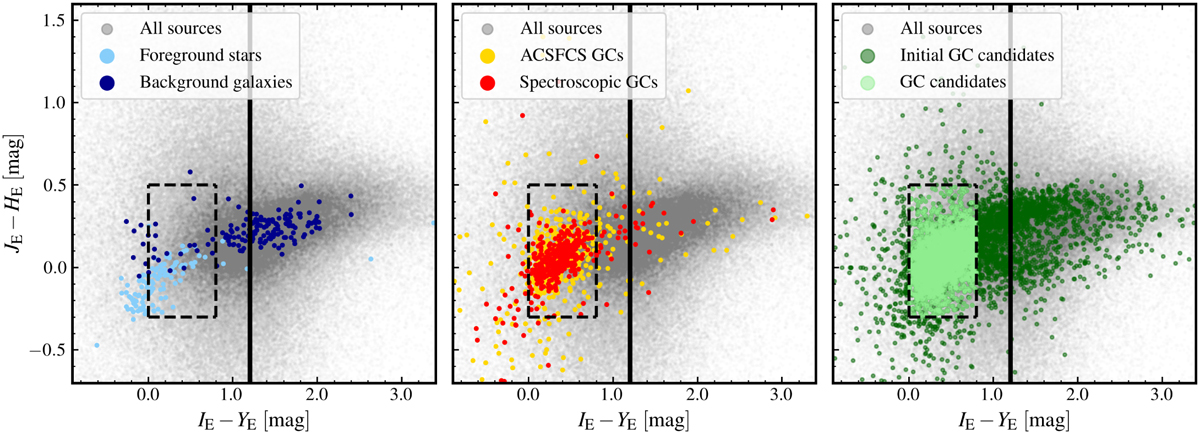
Fig. 6
Download original image
Three panels showing the Euclid colour-colour diagram with (IE − YE) plotted against the (IE − HE) colour index. In each panel, the grey dots show the distribution of all photometric sources. In the left panel, we show the location of foreground stars and background galaxies in cyan and blue, respectively. The middle panels show spectroscopically confirmed GCs as red points, and GCs in the ACSFCS catalogue as yellow points. In the third panel, we show the initial GC candidates as dark green points and the retained GC candidates in light green colours. The applied colour cuts are shown as a dashed box. These colour cuts are used to identify the intracluster GC candidates in the ERO-F data. However, we use a more relaxed colour cut for identifying GC candidates around dwarf galaxies. For that, we apply an upper limit in IE−YE , shown by the vertical solid black line.
Current usage metrics show cumulative count of Article Views (full-text article views including HTML views, PDF and ePub downloads, according to the available data) and Abstracts Views on Vision4Press platform.
Data correspond to usage on the plateform after 2015. The current usage metrics is available 48-96 hours after online publication and is updated daily on week days.
Initial download of the metrics may take a while.