Fig. 4
Download original image
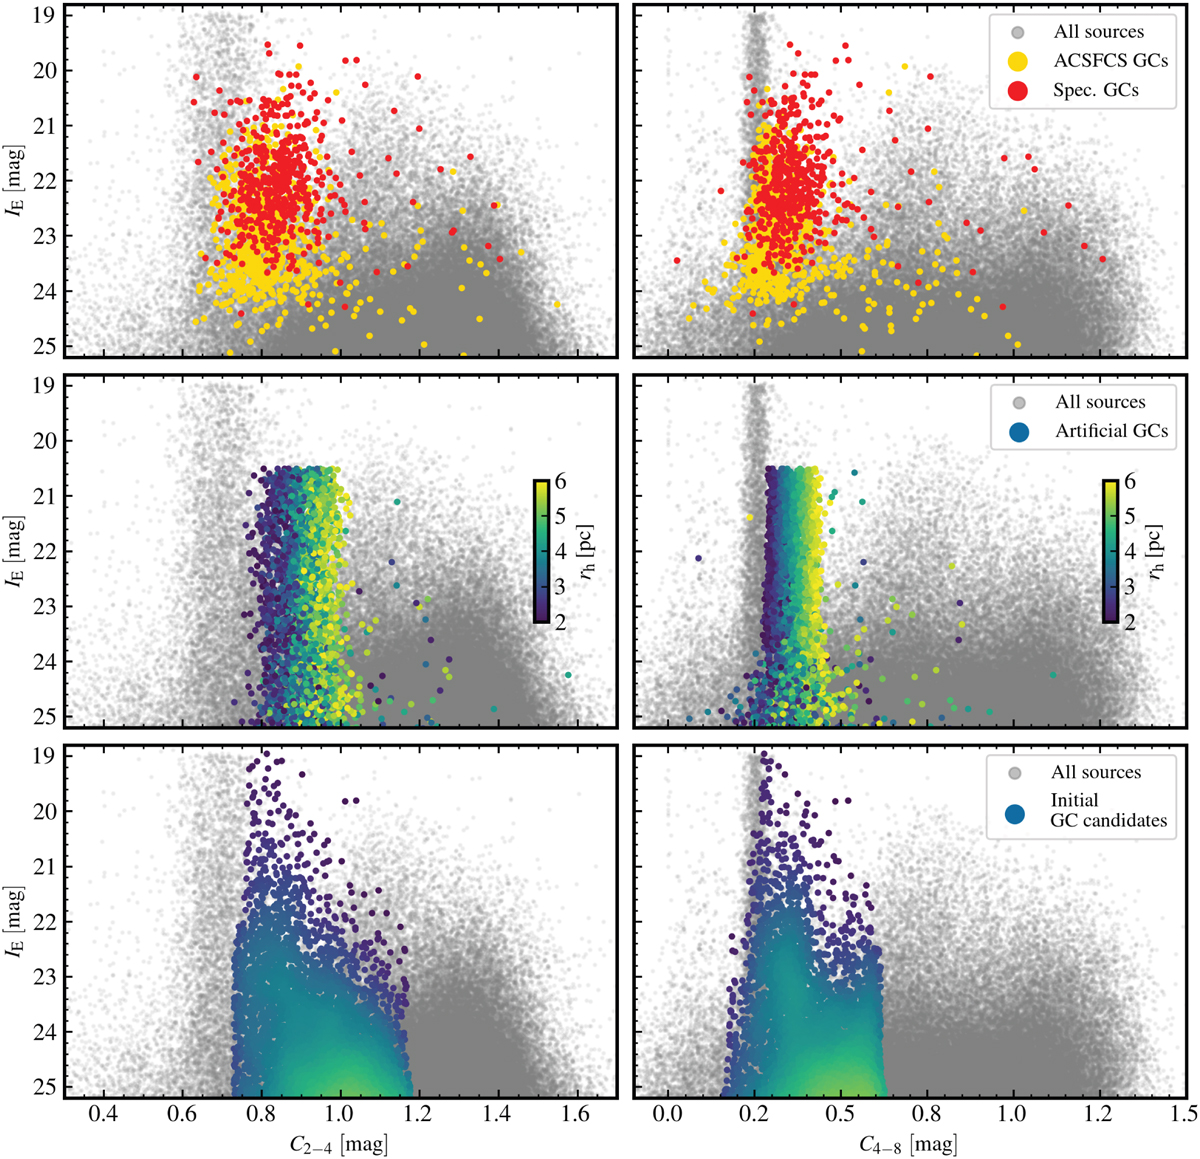
Compactness indices measured in IE and first step of the GC selection. The sources in the full catalogue are displayed in grey. Top panels: compactness indices of the spectroscopically confirmed GCs (red points), and of GCs in the ACSFCS catalogue (yellow points). These two samples serve as empirical references. The vertical sequences at C2−4 = 0.70 and C4−8 = 0.26 correspond to point sources. Objects on the right side of this sequence with a larger compactness index are extended sources. Objects with smaller compactness index are mostly artefacts (e.g. cosmic rays) in the data. Middle panels: Compactness indices of the 3000 artificial GCs with half-light radii between 2 and 6 pc, which were injected into the images (black points). Lower panels: compactness indices of the sources in the initial GC sample after selection based on their compactness indices, as described in Sect. 4.2 (green points). The colours in these panels demonstrate source density in the parameter space.
Current usage metrics show cumulative count of Article Views (full-text article views including HTML views, PDF and ePub downloads, according to the available data) and Abstracts Views on Vision4Press platform.
Data correspond to usage on the plateform after 2015. The current usage metrics is available 48-96 hours after online publication and is updated daily on week days.
Initial download of the metrics may take a while.