Fig. A.3
Download original image
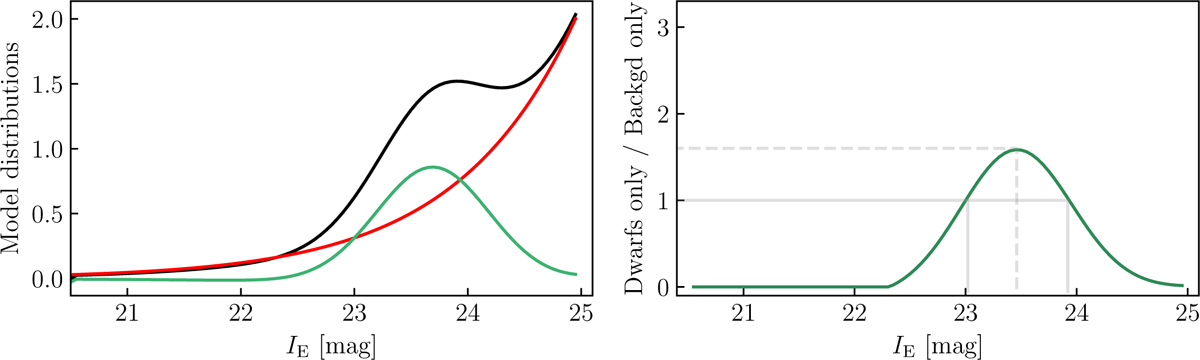
Derived model for the luminosity distribution of GC candidates towards dwarf galaxies. Left panel: Inferred magnitude distributions for the fit carried out within the range 20.5 < IE < 25, excluding two-thirds of the bright GCs (as in Fig. A.2). The distributions for all GC candidates for the background GCs (exponential) and for the dwarf-galaxy GCs (Gaussian) are shown in black, red, and green, respectively. Right panel: Ratio of the dwarf GCLF to the background GCLF in the model, with ratios of one and 1.6 highlighted.
Current usage metrics show cumulative count of Article Views (full-text article views including HTML views, PDF and ePub downloads, according to the available data) and Abstracts Views on Vision4Press platform.
Data correspond to usage on the plateform after 2015. The current usage metrics is available 48-96 hours after online publication and is updated daily on week days.
Initial download of the metrics may take a while.