Fig. A.1
Download original image
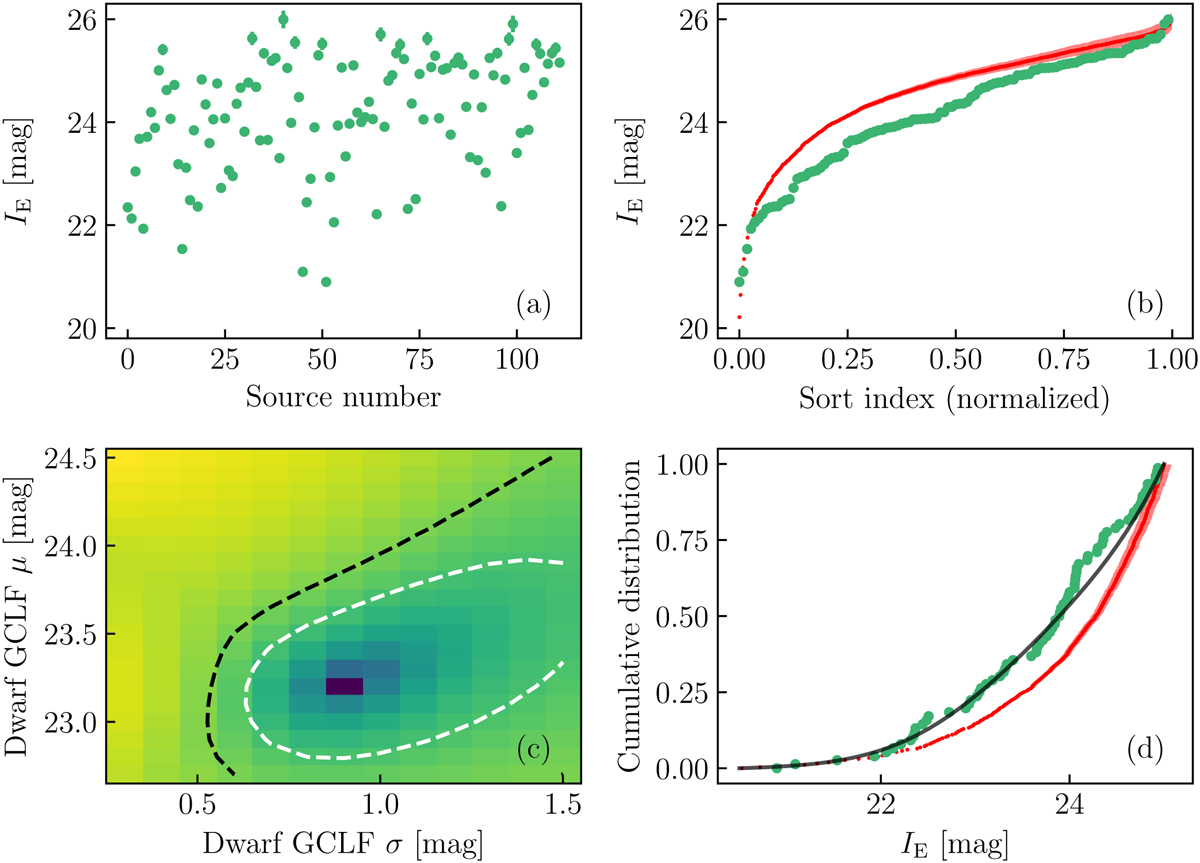
Data set of individual IE magnitudes of GC candidates and fits to the GCLF. (a): photometry of objects within 2 Re of the centres of 14 dwarf galaxies. (b): same data after sorting (green), compared with the sorted magnitudes of all the sources in background rings around dwarf galaxies (red). (c): map of posterior probabilities obtained when, for each (µ, σ)-pair, the value of β that maximises the posterior probability is retained. The white and black contours correspond, respectively, to an e-fold and a 10-fold decrease in probability compared to the best fit. (d): cumulative distributions of observed magnitudes together with the cumulative distribution of the best-fit model (black line).
Current usage metrics show cumulative count of Article Views (full-text article views including HTML views, PDF and ePub downloads, according to the available data) and Abstracts Views on Vision4Press platform.
Data correspond to usage on the plateform after 2015. The current usage metrics is available 48-96 hours after online publication and is updated daily on week days.
Initial download of the metrics may take a while.