Fig. 14
Download original image
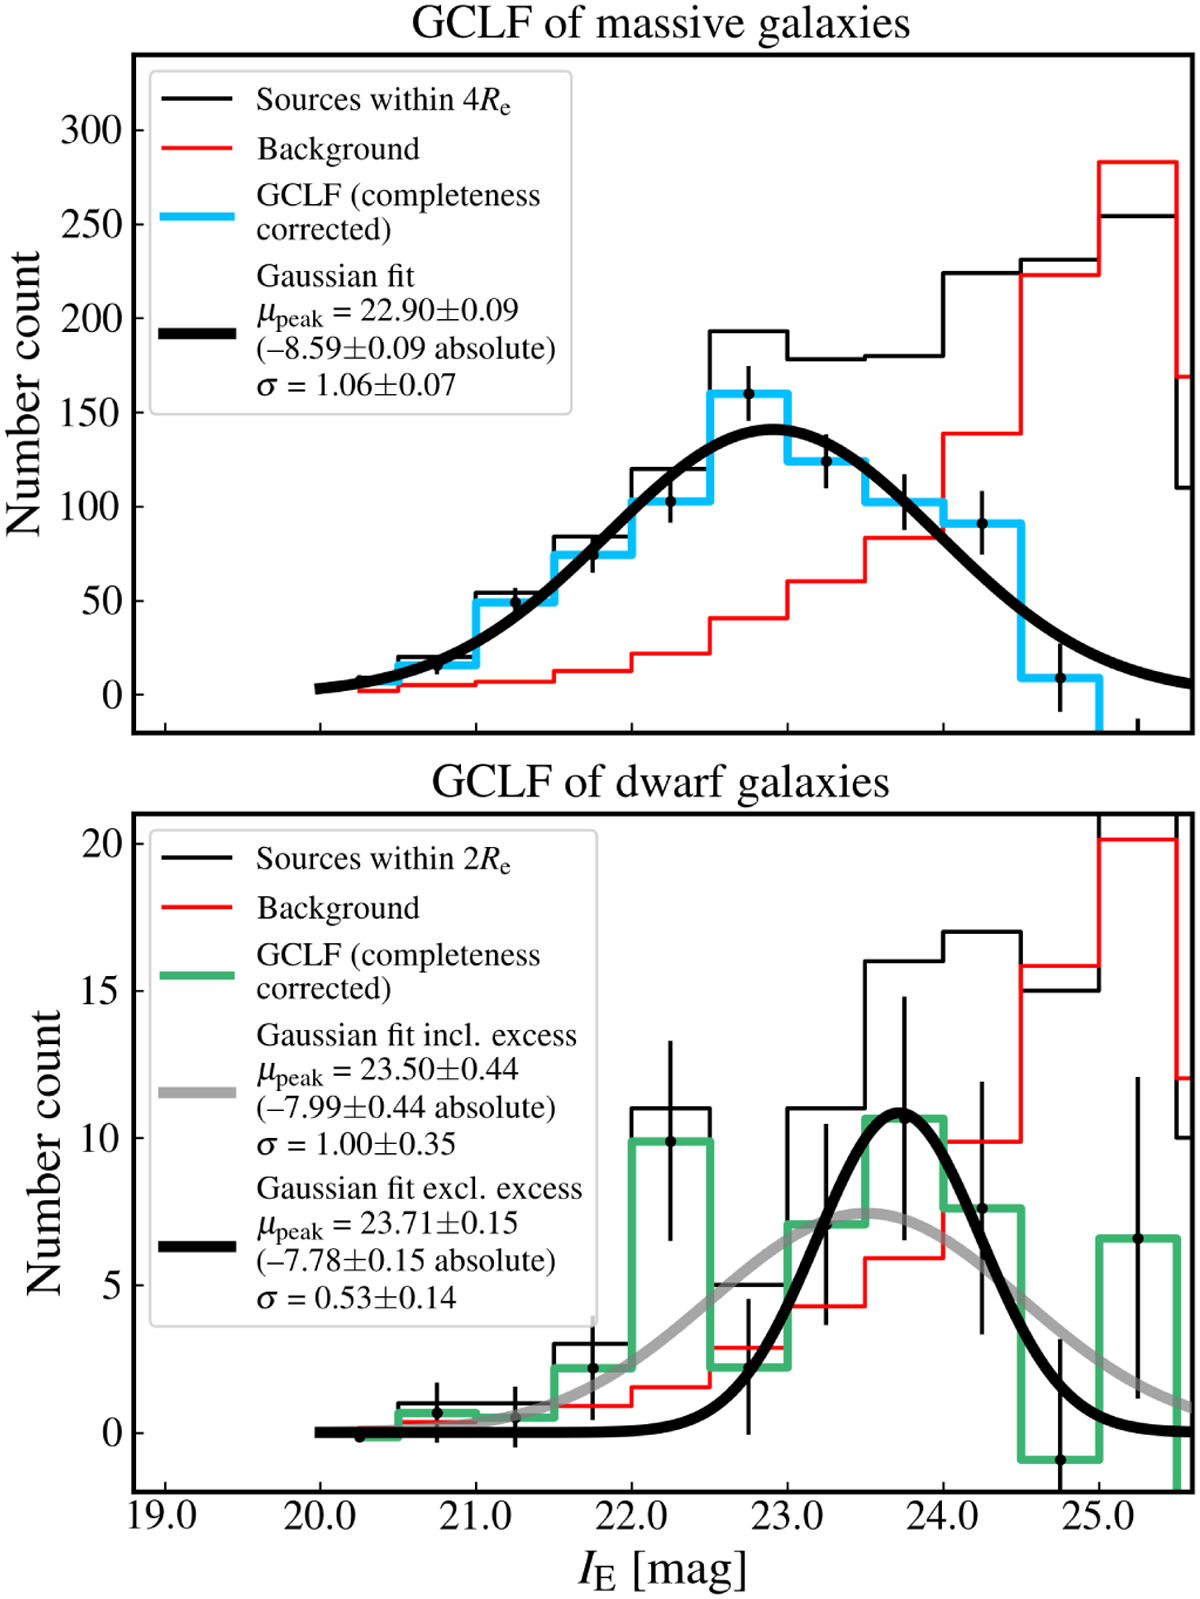
Stacked GCLF of massive galaxies (top) and dwarf galaxies (bottom). The GCLF is derived for the final GC candidates in this work (selected based on their compactness, colour and ellipticity). The black histogram shows all GC candidates within 4 Re and 2 Re of a given host galaxy for massive and dwarf galaxies, respectively. The red histogram shows the magnitude distribution of background sources, and the blue histogram is the background-corrected histogram. The best fit Gaussian to the background-corrected histogram is shown as the black line. The histograms are completeness-corrected. The errorbars represent the Poisson uncertainties for the number of GC within the magnitude bin and take into account the Poisson uncertainties from the (subtracted) background. The displayed best Gaussian fit for the GCLF of dwarf galaxies is done including and excluding the GC excess between IE = 22.0 and 22.5., shown with grey and black curves, respectively.
Current usage metrics show cumulative count of Article Views (full-text article views including HTML views, PDF and ePub downloads, according to the available data) and Abstracts Views on Vision4Press platform.
Data correspond to usage on the plateform after 2015. The current usage metrics is available 48-96 hours after online publication and is updated daily on week days.
Initial download of the metrics may take a while.