Fig. 13
Download original image
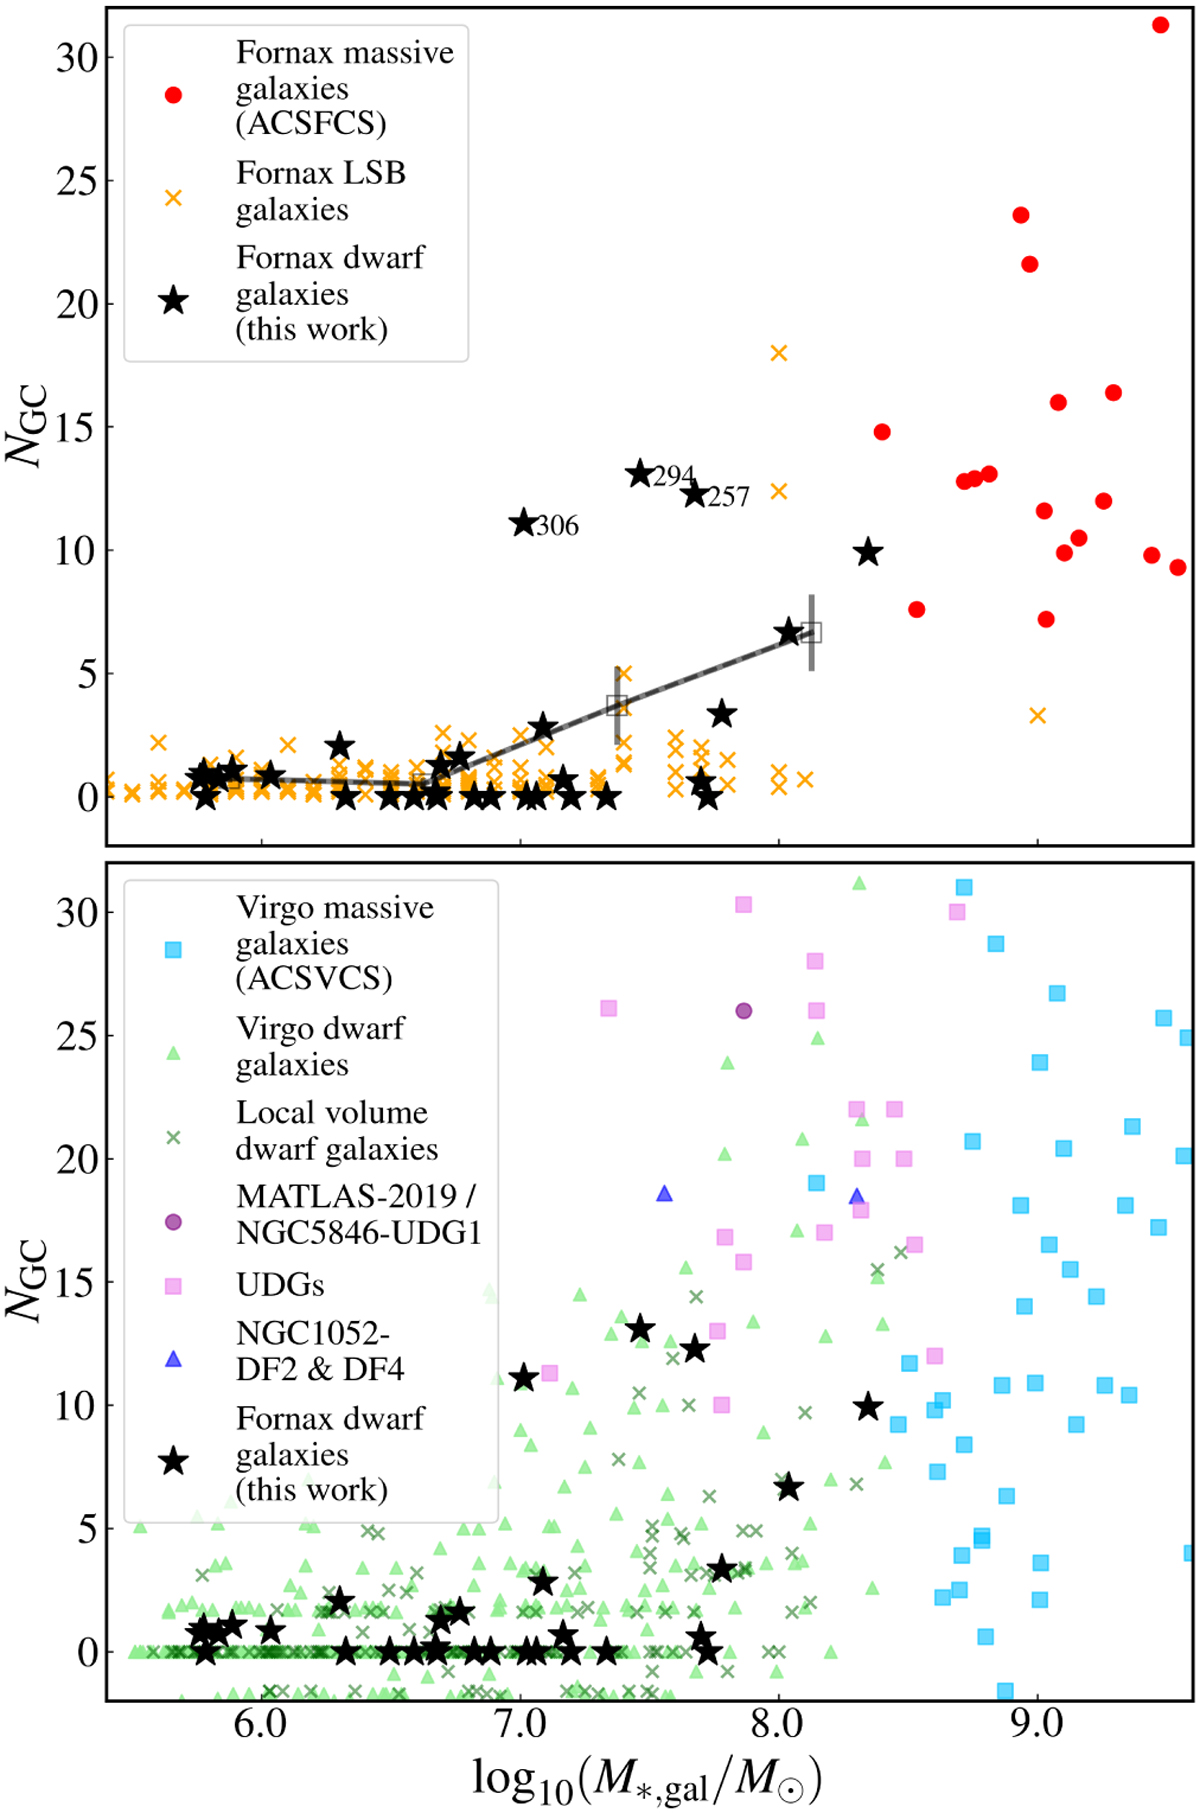
Total number of GCs as a function of the stellar mass of the host for the dwarf galaxies in this work (black stars). Top: Comparison with other studies in the Fornax cluster. The total GC numbers of massive galaxies from ACSFCS from Liu et al. (2019) are shown as red discs and those of the Fornax cluster central LSB galaxies from Prole et al. (2018) as yellow crosses. The black curve shows the average GC number for a given mass range of dwarf galaxies in this work (30 galaxies). Error bars correspond to the uncertainties on the mean. The three relatively GC-rich dwarf galaxies above this curve are indicated by the last three digits of their FDS name. Bottom: GC numbers for galaxies in other environments. Massive galaxies from the ACS Virgo Cluster Survey (Peng et al. 2008) are shown as blue squares, Virgo cluster dwarf galaxies from Carleton et al. (2021) as green triangles, dwarf galaxies in the local Volume from Carlsten et al. (2022) as green crosses, NGC5846-UDG1/MATLAS2019 from Müller et al. (2021) with a purple disc (the value of 54 GCs reported by Danieli et al. 2022 for this galaxy is beyond the range displayed), UDGs from Saifollahi et al. (2022) and Ferré-Mateu et al. (2023) (see references therein) as pink squares, and NGC1052 DF2 and DF4 from Shen et al. (2021) as dark blue triangles.
Current usage metrics show cumulative count of Article Views (full-text article views including HTML views, PDF and ePub downloads, according to the available data) and Abstracts Views on Vision4Press platform.
Data correspond to usage on the plateform after 2015. The current usage metrics is available 48-96 hours after online publication and is updated daily on week days.
Initial download of the metrics may take a while.