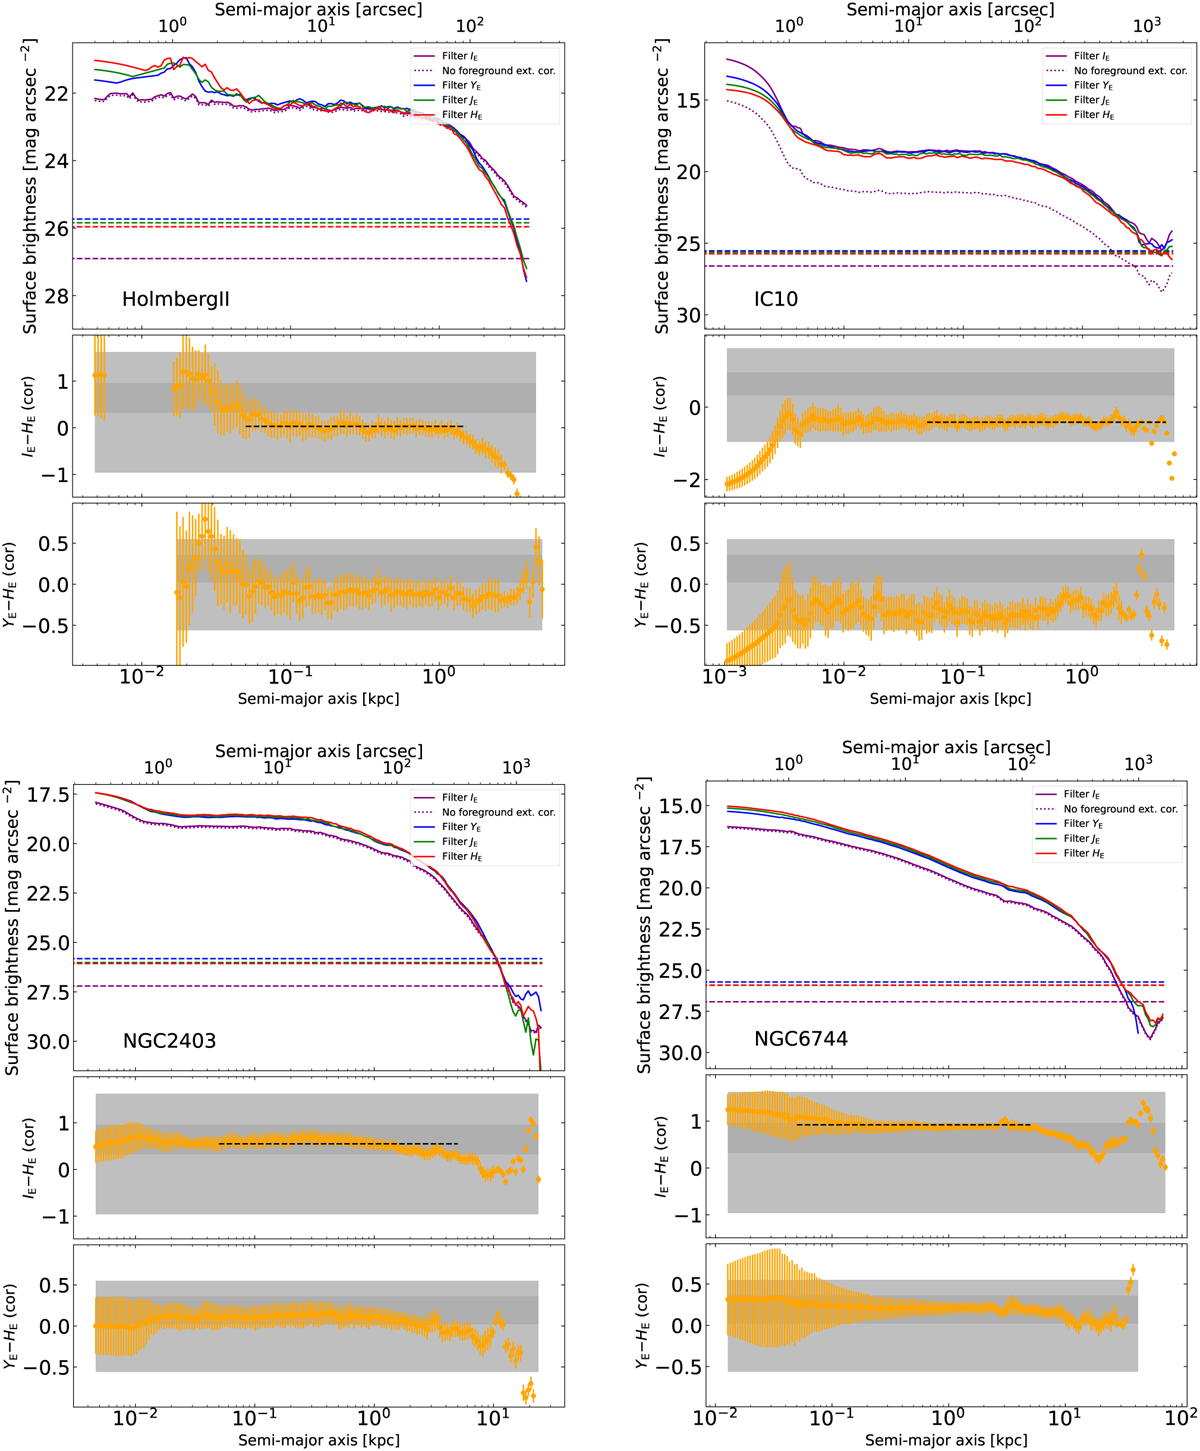
Fig. C.1
Download original image
Surface brightness and color profiles extracted by AutoProf, as described in the text: Holmberg II and IC 10 in the top row; and NGC 2403 and NGC 6744 in the bottom. The four bands are given by purple, blue, green, and red for IE, YE, JE, and HE, respectively. The 1σ SB limits from AutoProf in units of mag arcsec-2 are shown as dashed horizontal lines, with colors corresponding to the Euclid bands. The fluxes have been corrected for foreground extinction (Sect. 4.1) in order to be consistent with the IE - HE radial color gradient shown in the middle panel, and YE - HE shown at the bottom. The uncorrected IE profile is shown as a dotted (purple) curve in the top panel. The mean IE - HE color over typically a factor of 100 in radius in the inner galaxy is shown as a horizontal dashed line in the middle panel.
Current usage metrics show cumulative count of Article Views (full-text article views including HTML views, PDF and ePub downloads, according to the available data) and Abstracts Views on Vision4Press platform.
Data correspond to usage on the plateform after 2015. The current usage metrics is available 48-96 hours after online publication and is updated daily on week days.
Initial download of the metrics may take a while.