Fig. 5
Download original image
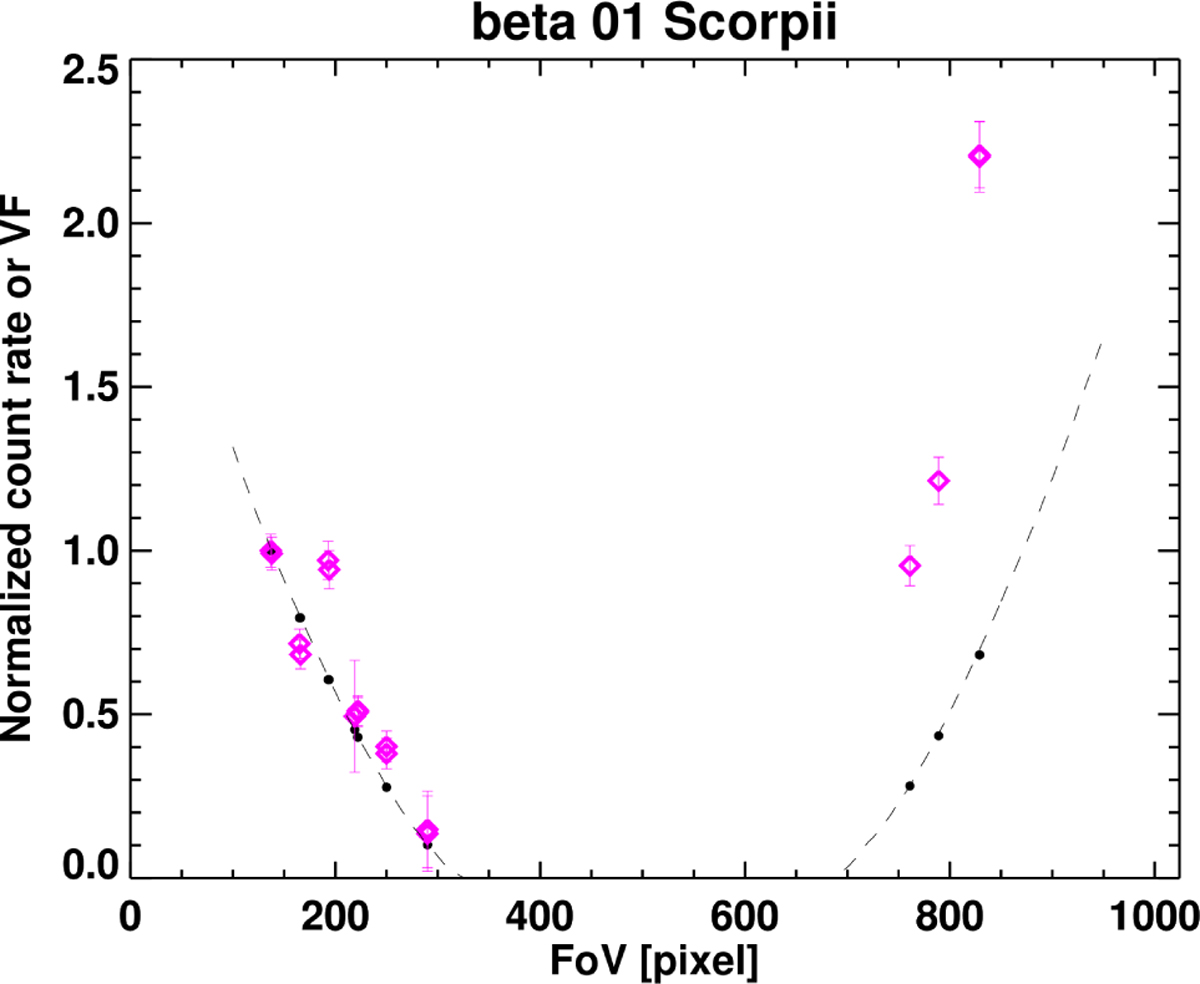
Comparison between the normalized count rate (magenta diamonds) of β 01 Scorpii and the normalized VF (black dots). The VF is evaluated in the same positions of the star along the FoV. The black dashed line represents the continuous trend of VF. All trends have been normalized to the value of the first frame of this observation. In the figure, a discrepancy between the star signal and the VF trend is evident, on the east and the west sides of the UV FoV. The star signal error bars are multiplied by a factor 3 for clarity of the plot. The trend of the count rate corrected for the VF is shown in the first panel of Fig. 7.
Current usage metrics show cumulative count of Article Views (full-text article views including HTML views, PDF and ePub downloads, according to the available data) and Abstracts Views on Vision4Press platform.
Data correspond to usage on the plateform after 2015. The current usage metrics is available 48-96 hours after online publication and is updated daily on week days.
Initial download of the metrics may take a while.