Fig. 9
Download original image
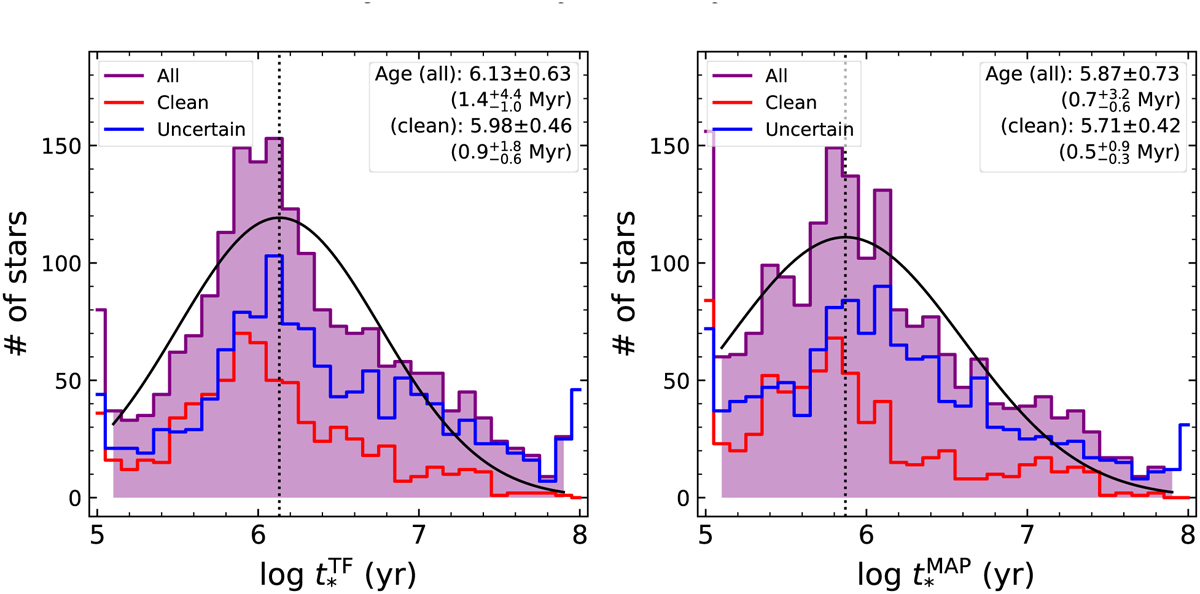
Histograms of stellar age calculated from the TF parameters (left) and stellar age derived from the MAP values (right). The red and blue lines show the distribution of the Clean and Uncertain sample groups, respectively. We fit the purple shaded area with a log-normal function and plot the best-fit curve as the black solid line. The peak of the best-fit curve, denoted by a vertical black dotted line, is used as an average stellar age.
Current usage metrics show cumulative count of Article Views (full-text article views including HTML views, PDF and ePub downloads, according to the available data) and Abstracts Views on Vision4Press platform.
Data correspond to usage on the plateform after 2015. The current usage metrics is available 48-96 hours after online publication and is updated daily on week days.
Initial download of the metrics may take a while.