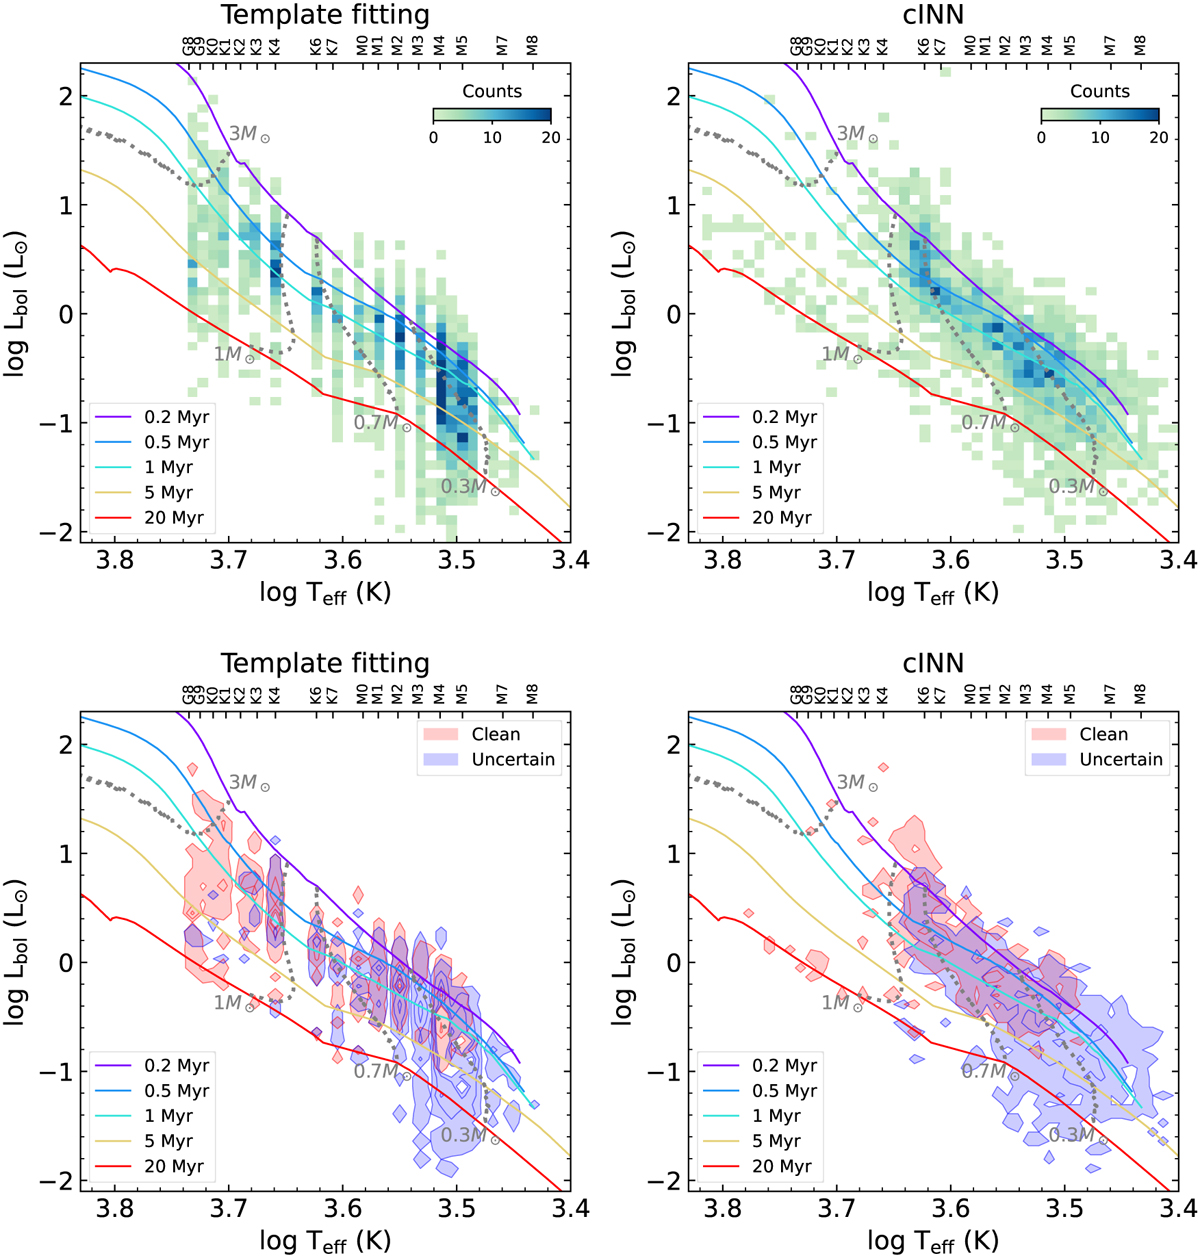
Fig. 8
Download original image
Hertzsprung-Russell diagrams of Tr14 stars based on the stellar parameters from IT24 (left panels) and the stellar parameters from this work (right panels). In the upper panels, we plot 2D histograms using all samples, while in the lower panels, we plot contours dividing the samples into the Clean (red) and the Uncertain (blue) groups. We overplot PARSEC theoretical evolutionary tracks (Bressan et al. 2012) where solid lines indicate isochrones from 0.2 to 20 Myr and dashed lines indicate isomasses of 0.3, 0.7, 1, and 3 M⊙.
Current usage metrics show cumulative count of Article Views (full-text article views including HTML views, PDF and ePub downloads, according to the available data) and Abstracts Views on Vision4Press platform.
Data correspond to usage on the plateform after 2015. The current usage metrics is available 48-96 hours after online publication and is updated daily on week days.
Initial download of the metrics may take a while.