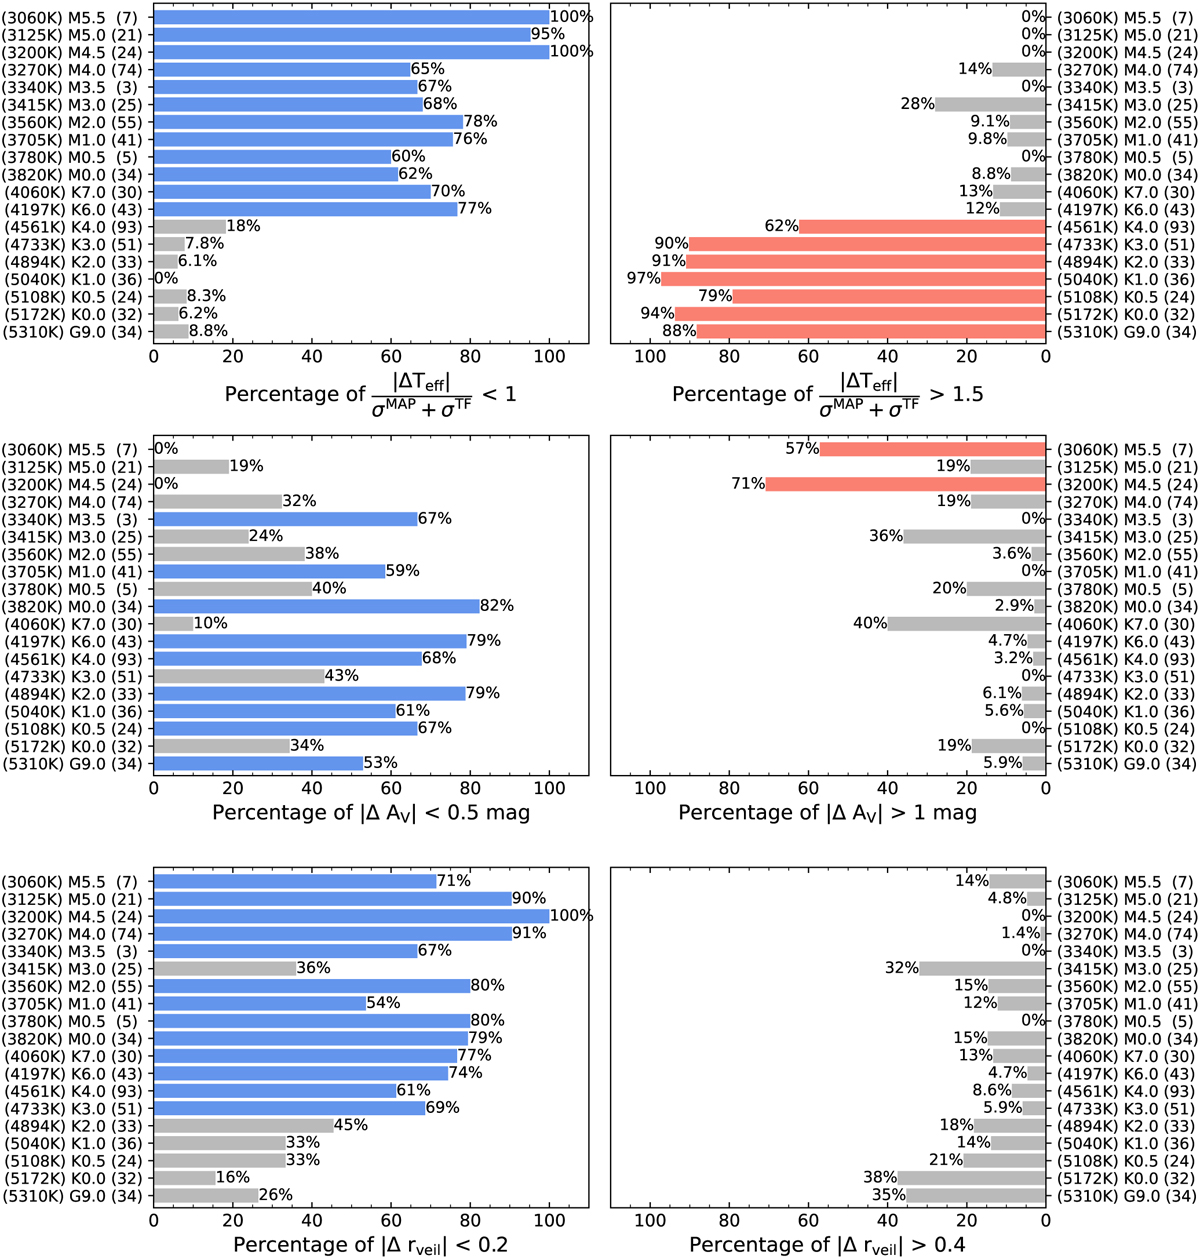
Fig. 6
Download original image
Calculate fraction of samples where the difference between TF parameter and the MAP value is either smaller than the given criterion (left panels) or larger than the given criterion (right panels) within each spectral type group based on the Teff from TF parameters. We only use the Clean samples in this figure. The y-axis labels present the corresponding spectral type and the number of samples belonging to the spectral type group. We highlight the bar in blue (left panels) or red (right panels) when the fraction is higher than 50%.
Current usage metrics show cumulative count of Article Views (full-text article views including HTML views, PDF and ePub downloads, according to the available data) and Abstracts Views on Vision4Press platform.
Data correspond to usage on the plateform after 2015. The current usage metrics is available 48-96 hours after online publication and is updated daily on week days.
Initial download of the metrics may take a while.