Fig. 4
Download original image
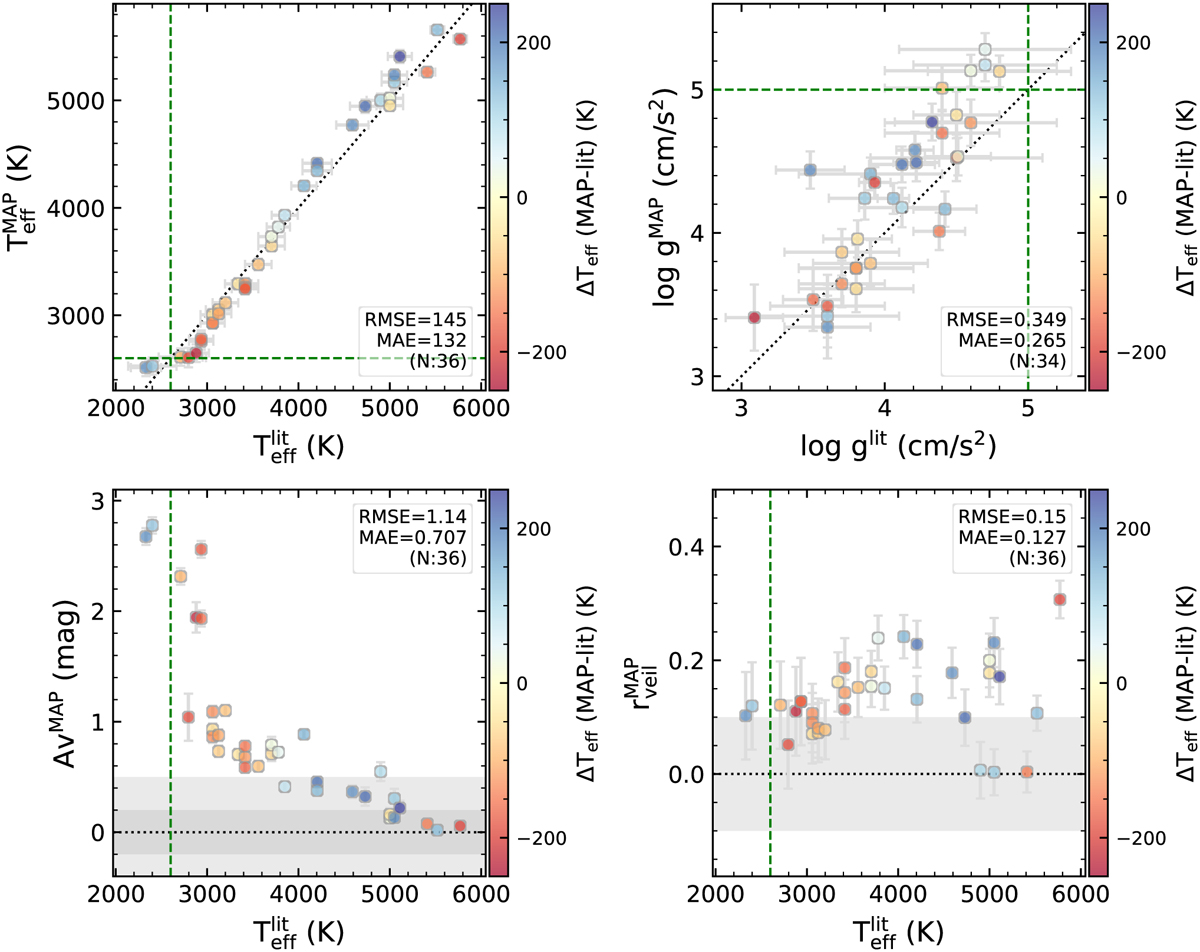
Comparison of MAP estimates with literature values for 36 class III template stars. The colour indicates the temperature difference between MAP estimates and literature values and the dotted green lines indicate the training range of the cINN. The texts in each panel show the root mean square errors and mean absolute errors between the MAP estimates and the literature values. Since these template stars are class III and have negligible extinction (AV < 0.5 mag) with an estimation uncertainty of 0.2 mag (Manara et al. 2017), we regard ![]() = 0 and
= 0 and ![]() = 0. The horizontal grey areas in the lower left panel represent ±0.2 mag and ±0.5 mag, while that in the lower right panel represents ±0.1.
= 0. The horizontal grey areas in the lower left panel represent ±0.2 mag and ±0.5 mag, while that in the lower right panel represents ±0.1.
Current usage metrics show cumulative count of Article Views (full-text article views including HTML views, PDF and ePub downloads, according to the available data) and Abstracts Views on Vision4Press platform.
Data correspond to usage on the plateform after 2015. The current usage metrics is available 48-96 hours after online publication and is updated daily on week days.
Initial download of the metrics may take a while.