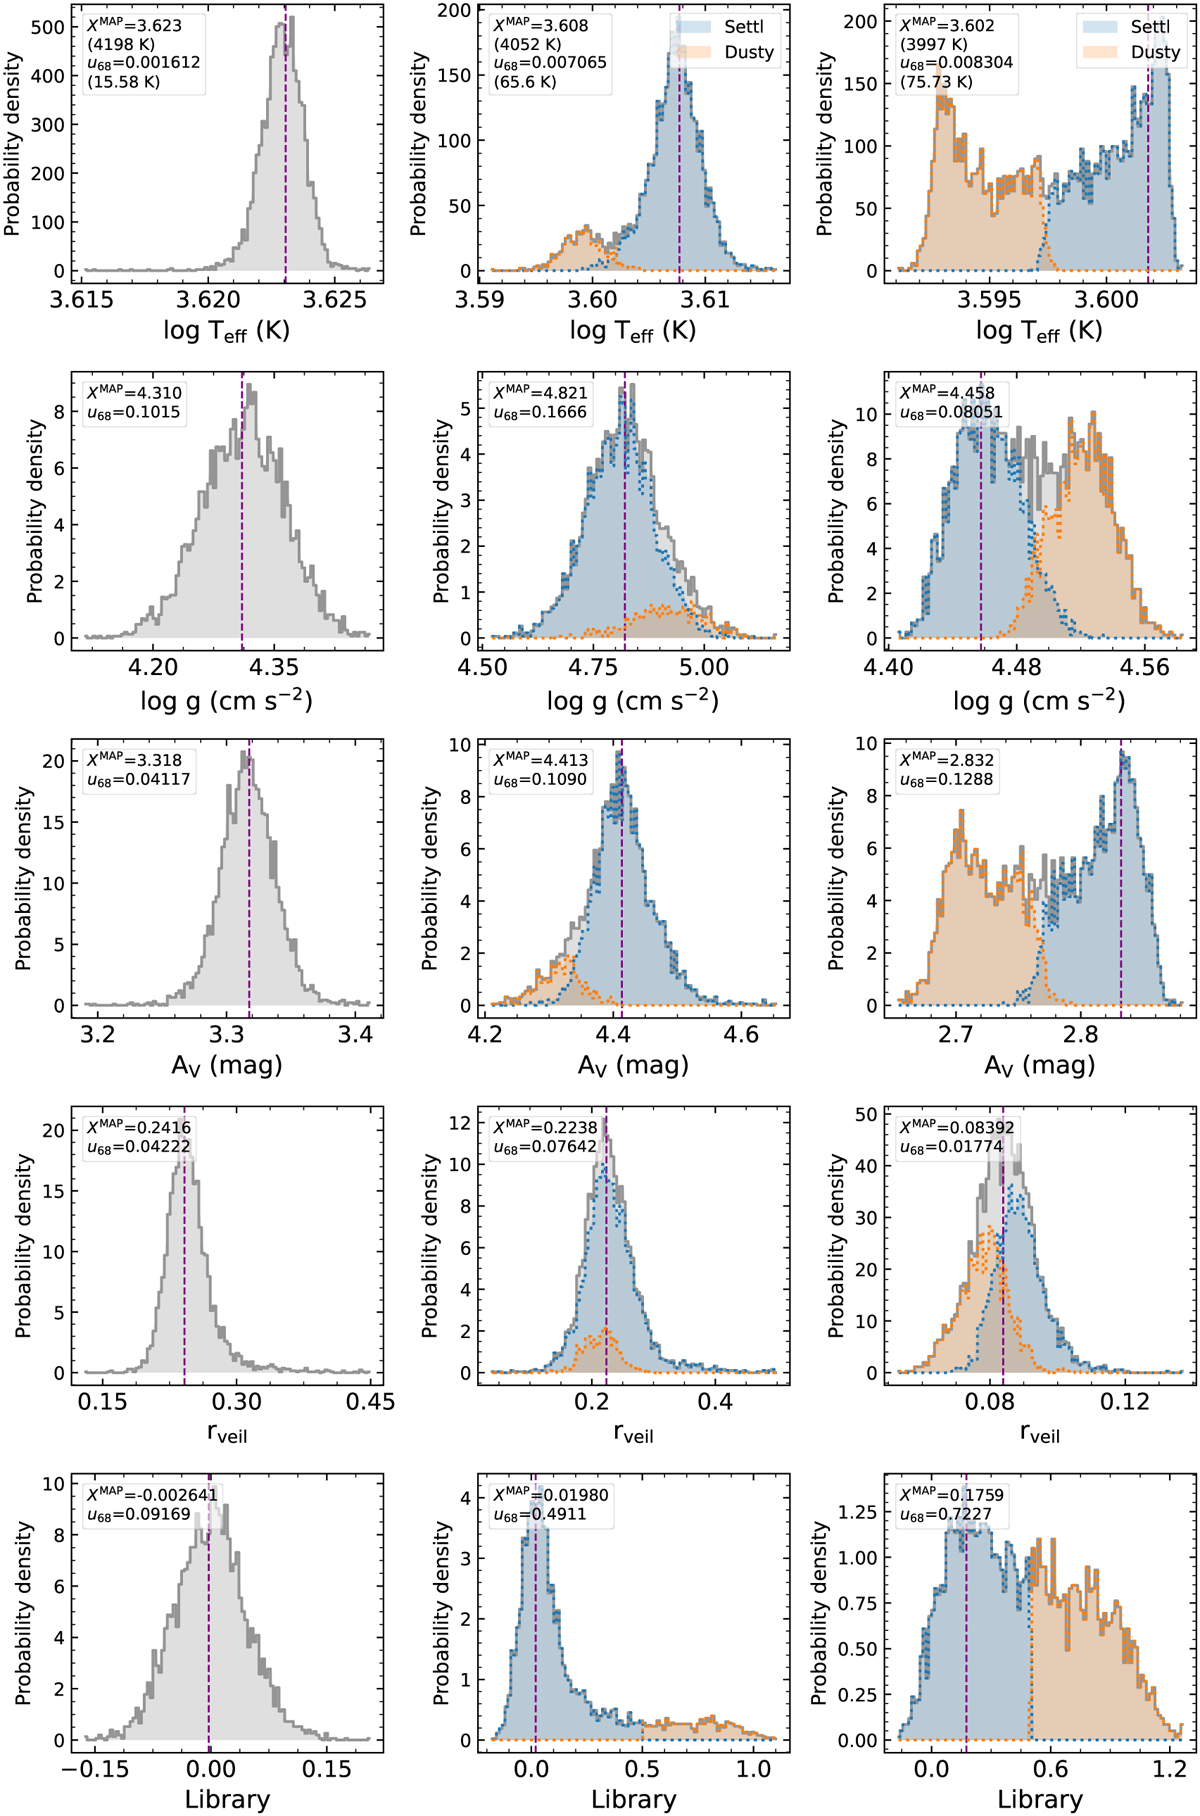
Fig. C.1
Download original image
Posterior probability distributions (grey) of the five target parameters. Each column corresponds to a different sample drawn from the Clean group. The first column shows an example of an unimodal posterior distribution with a clear single peak (i.e. MAP estimate), which is the most common case in our results. The other columns represent degenerate cases where the posterior distribution of some parameters has a multimodal shape. In these cases, we divide the posterior distribution into two groups depending on the posterior estimate of the Phoenix library origin: a library value of 0 denotes Settl (blue shading) and a value of 1 denotes Dusty (orange shading). In each panel, we present the MAP estimate and the uncertainty at 68% confidence interval (u68) in the text box.
Current usage metrics show cumulative count of Article Views (full-text article views including HTML views, PDF and ePub downloads, according to the available data) and Abstracts Views on Vision4Press platform.
Data correspond to usage on the plateform after 2015. The current usage metrics is available 48-96 hours after online publication and is updated daily on week days.
Initial download of the metrics may take a while.