Fig. B.3
Download original image
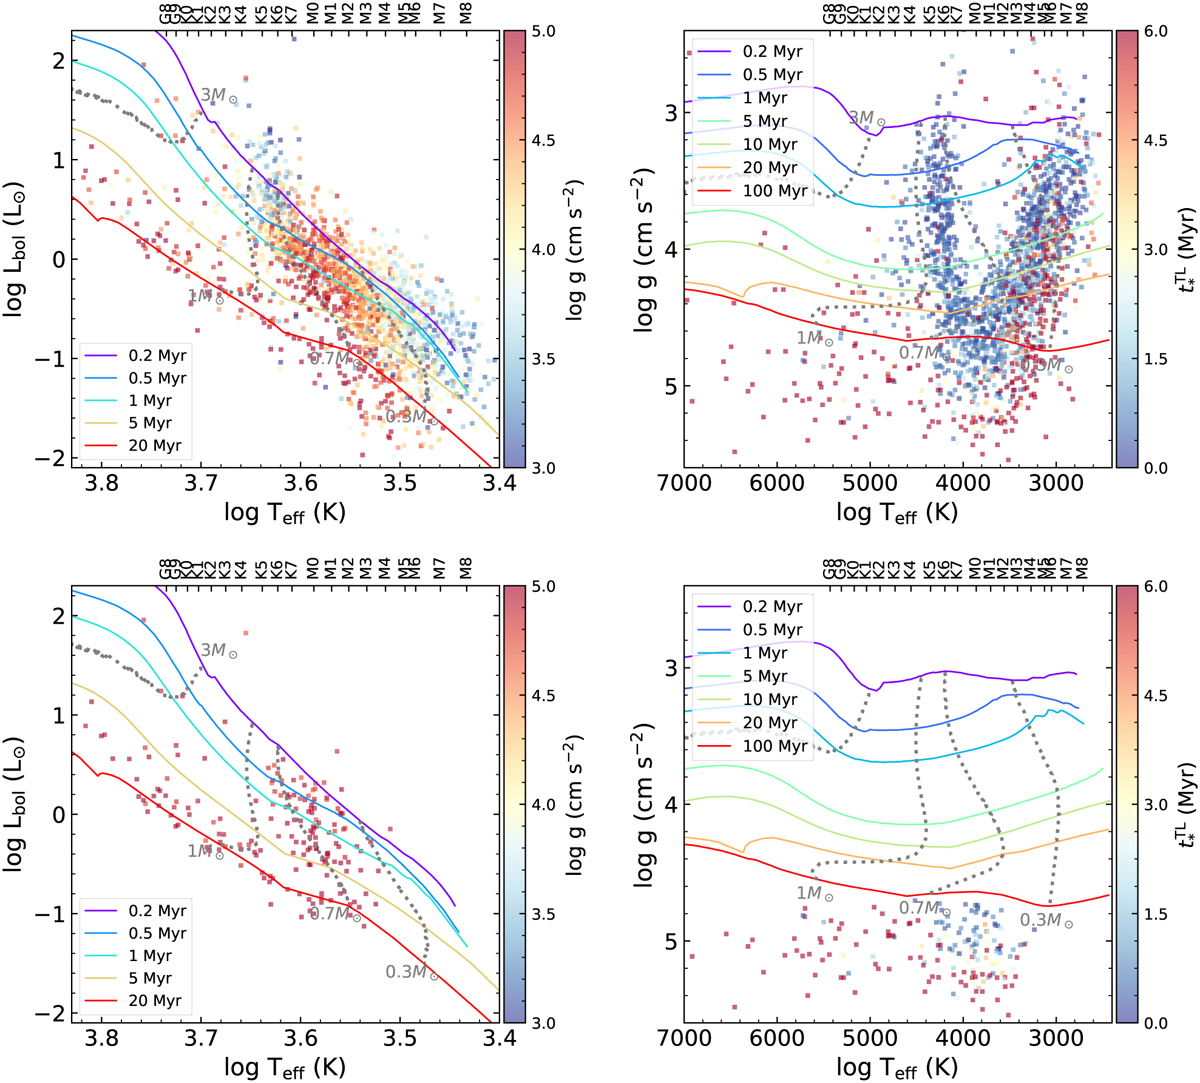
Hertzsprung-Russell diagrams (left) and Kiel diagrams (right) based on parameters obtained by cINN in this work using all 2051 Tr14 samples (upper panels) and using only 177 stars with surface gravities higher than 4.5 considering 3-σ estimation uncertainty. The colour in the HR diagrams indicates log g estimates while the colour in the log g – Teff diagrams represents stellar age derived from bolometric luminosity and Teff using PARSEC evolutionary tracks (Bressan et al. 2012). We overplot PARSEC theoretical evolutionary tracks (Bressan et al. 2012) where solid lines indicate isochrones from 0.2 to 100 Myr and dashed lines indicate isomasses of 0.3, 0.7, 1, and 3 M⊙.
Current usage metrics show cumulative count of Article Views (full-text article views including HTML views, PDF and ePub downloads, according to the available data) and Abstracts Views on Vision4Press platform.
Data correspond to usage on the plateform after 2015. The current usage metrics is available 48-96 hours after online publication and is updated daily on week days.
Initial download of the metrics may take a while.