Fig. A.4
Download original image
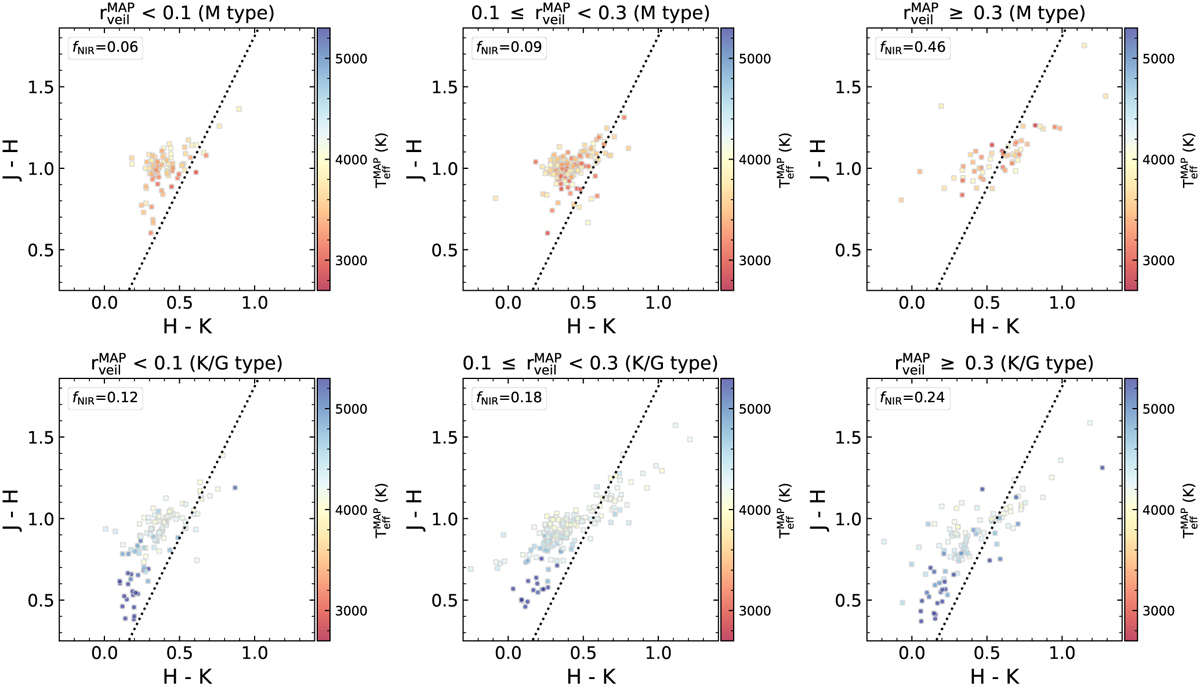
Colour–colour diagrams for the Clean samples using the NIR photometry data from HAWK-I catalouge (Preibisch et al. 2011a). We divide samples into six groups using MAP estimates: M-type stars (Teff < 4000 K), K/G-type stars (Teff ≥ 4000 K), rveil < 0.1, 0.1 ≤ rveil < 0.3, and rveil > 0.3. The colour of each star indicates the corresponding Teff value. The black dashed lines with a slope of 1.86 indicate the NIR excess selection threshold from Zeidler et al. (2016), where stars located to the right of the dashed line are classified as having NIR excess in IT24. We present the fraction of stars with NIR excess at the upper left corner of each panel (fNIR).
Current usage metrics show cumulative count of Article Views (full-text article views including HTML views, PDF and ePub downloads, according to the available data) and Abstracts Views on Vision4Press platform.
Data correspond to usage on the plateform after 2015. The current usage metrics is available 48-96 hours after online publication and is updated daily on week days.
Initial download of the metrics may take a while.