Fig. A.1
Download original image
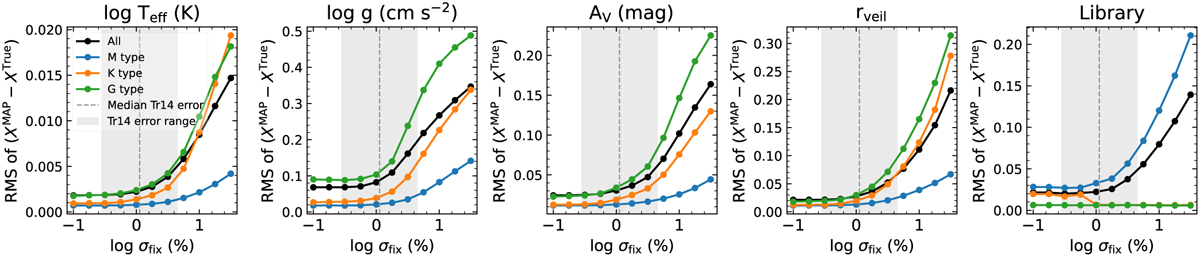
RMSE of the MAP estimates for all synthetic test models (black), M-type test models (blue, 2600 K ≤ Teff ≤ 4000 K), K-type test models (orange, 4000 K < Teff ≤ 5250 K), and G-type test models (green, 5250 K < Teff ≤ 6000 K) at 11 different relative flux errors. The grey horizontal dashed line and shaded area represent the median (1.12%) and standard deviation (0.77 dex) of the relative flux error (σmed) of Tr14 samples in the Clean group.
Current usage metrics show cumulative count of Article Views (full-text article views including HTML views, PDF and ePub downloads, according to the available data) and Abstracts Views on Vision4Press platform.
Data correspond to usage on the plateform after 2015. The current usage metrics is available 48-96 hours after online publication and is updated daily on week days.
Initial download of the metrics may take a while.