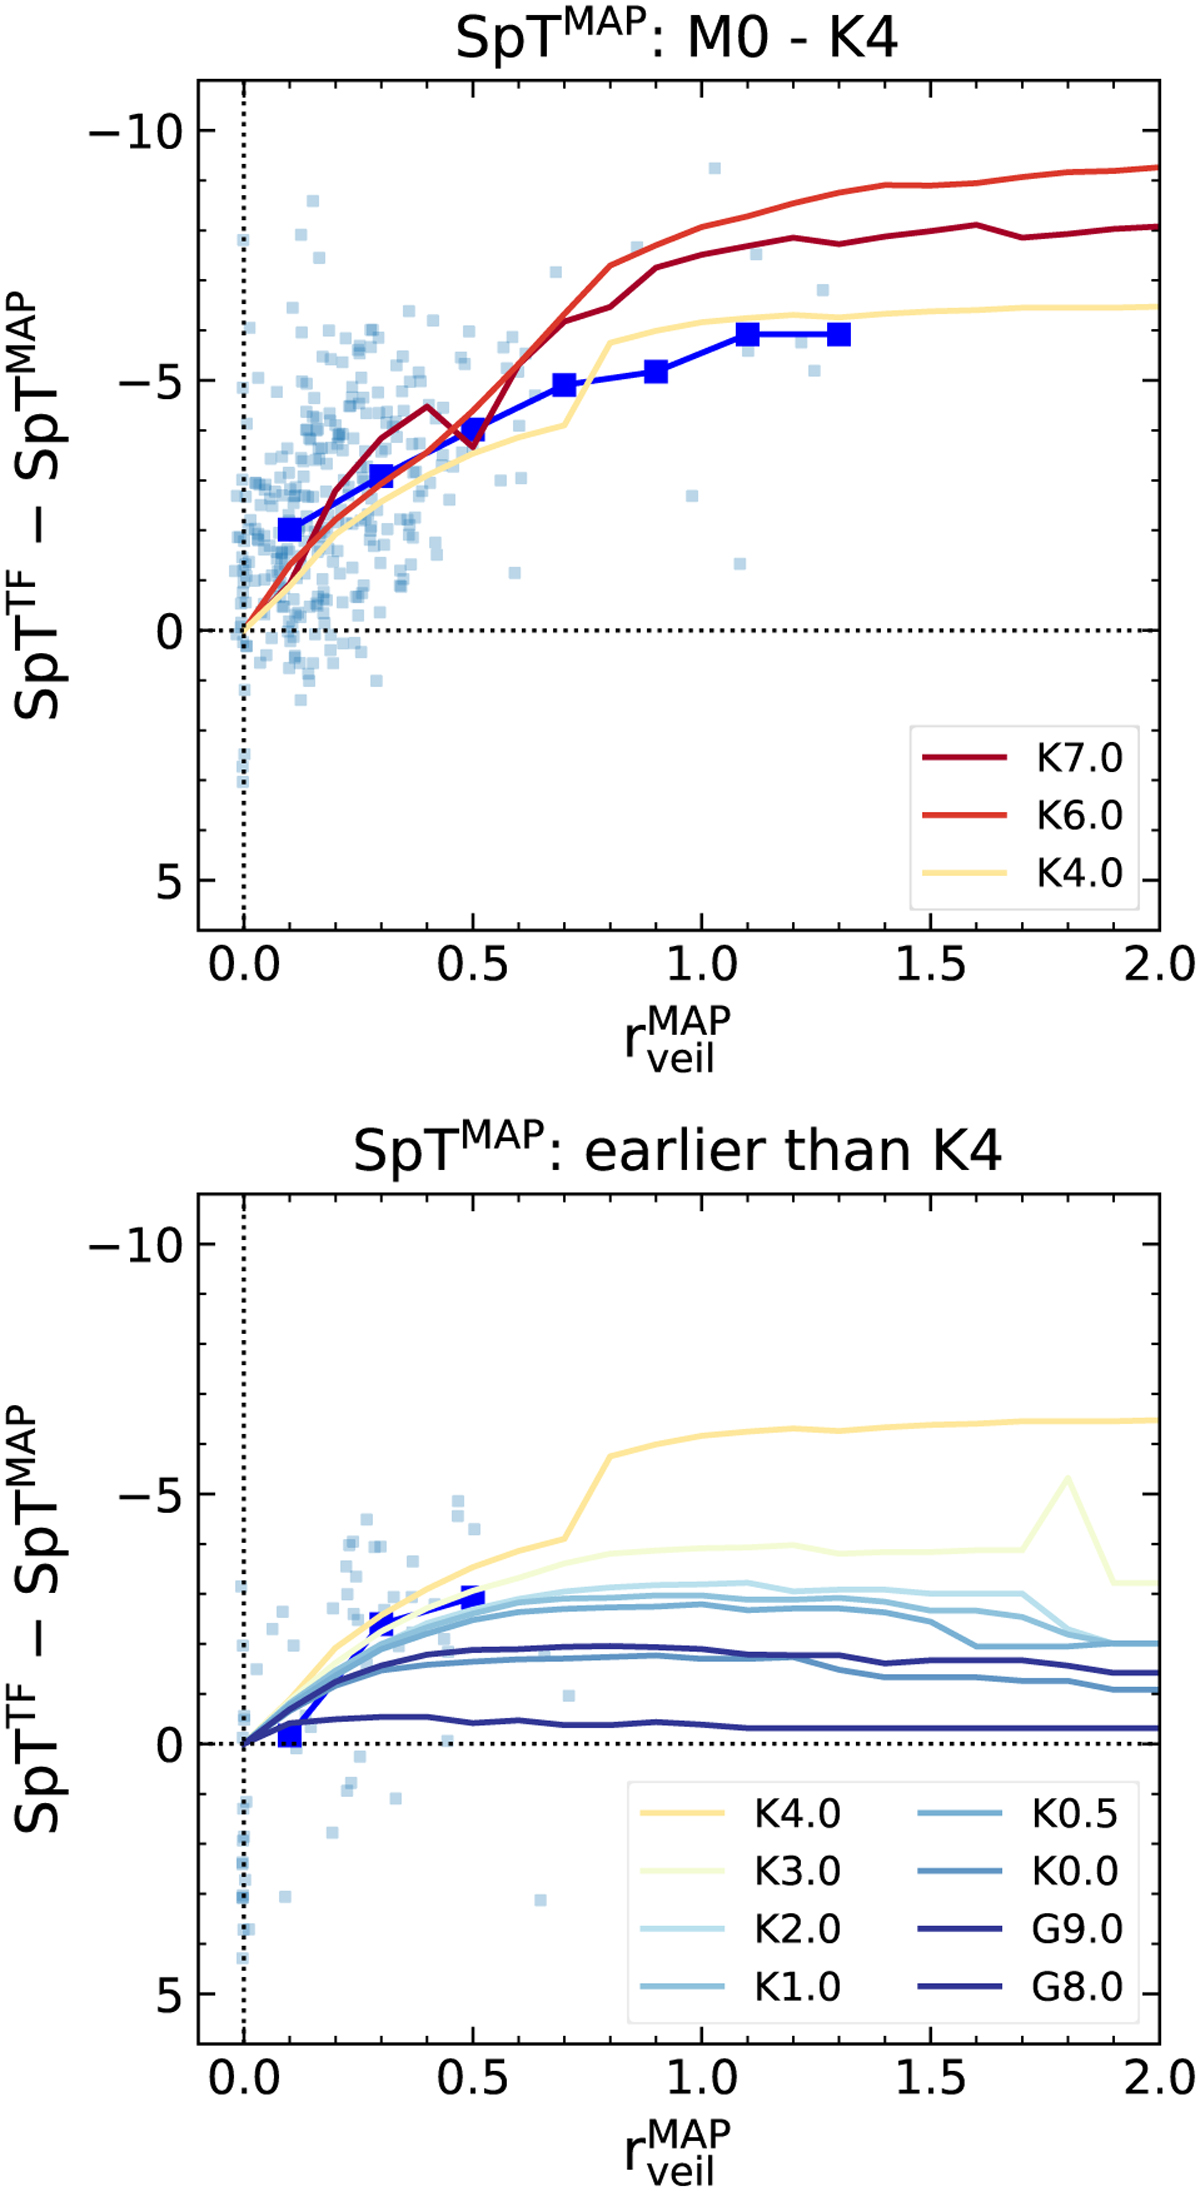
Fig. 15

Download original image
Comparison of spectral type differences between TF parameters and MAP values to the MAP veiling values for the Clean samples of Tr14 (blue dots). The samples are divided into two groups depending on the spectral type based on the MAP values. Stars classified as G8 by template fitting are excluded. The blue squares represent the average values calculated within the veiling interval of 0.2. When calculating the average values, we exclude stars whose MAP-based temperature exceeds the maximum template fitting temperature of 5430 K (G8 type). The coloured lines correspond to the curves presented in Fig. 14, which show the change of the spectral type as a function of the veiling tested on the template stars.
Current usage metrics show cumulative count of Article Views (full-text article views including HTML views, PDF and ePub downloads, according to the available data) and Abstracts Views on Vision4Press platform.
Data correspond to usage on the plateform after 2015. The current usage metrics is available 48-96 hours after online publication and is updated daily on week days.
Initial download of the metrics may take a while.


