Fig. 13
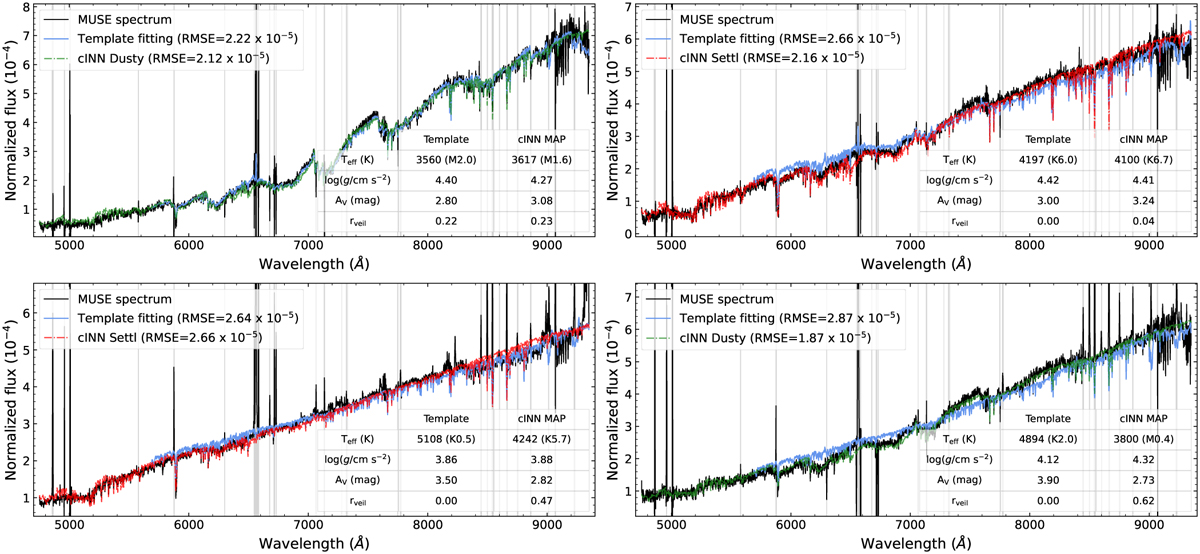
Download original image
Four examples of MUSE spectra (solid black line) together with the best-matching modified template spectra (solid blue line) chosen in IT24 and the resimulated Pheonix model spectra based on the cINN predictions (MAP estimates). The resimulated spectrum is described by either a red (Settl) or green (Dusty) dash-dot line depending on the MAP estimate of the library flag. For both the template fitting and cINN-based result, we present RMSEs between the fitted spectra and the original MUSE spectrum in the legend and list the measured stellar parameters in the table. All the spectra are normalised by the sum of the fluxes across all spectral bins within the common wavelength range between the template spectrum and MUSE spectrum (i.e. 5600–9350 Å) excluding the bins masked due to emission lines (grey shades). The surface gravity value for the template is the log g value of the corresponding template star, not measured from the Tr14 spectrum.
Current usage metrics show cumulative count of Article Views (full-text article views including HTML views, PDF and ePub downloads, according to the available data) and Abstracts Views on Vision4Press platform.
Data correspond to usage on the plateform after 2015. The current usage metrics is available 48-96 hours after online publication and is updated daily on week days.
Initial download of the metrics may take a while.