Fig. 12
Download original image
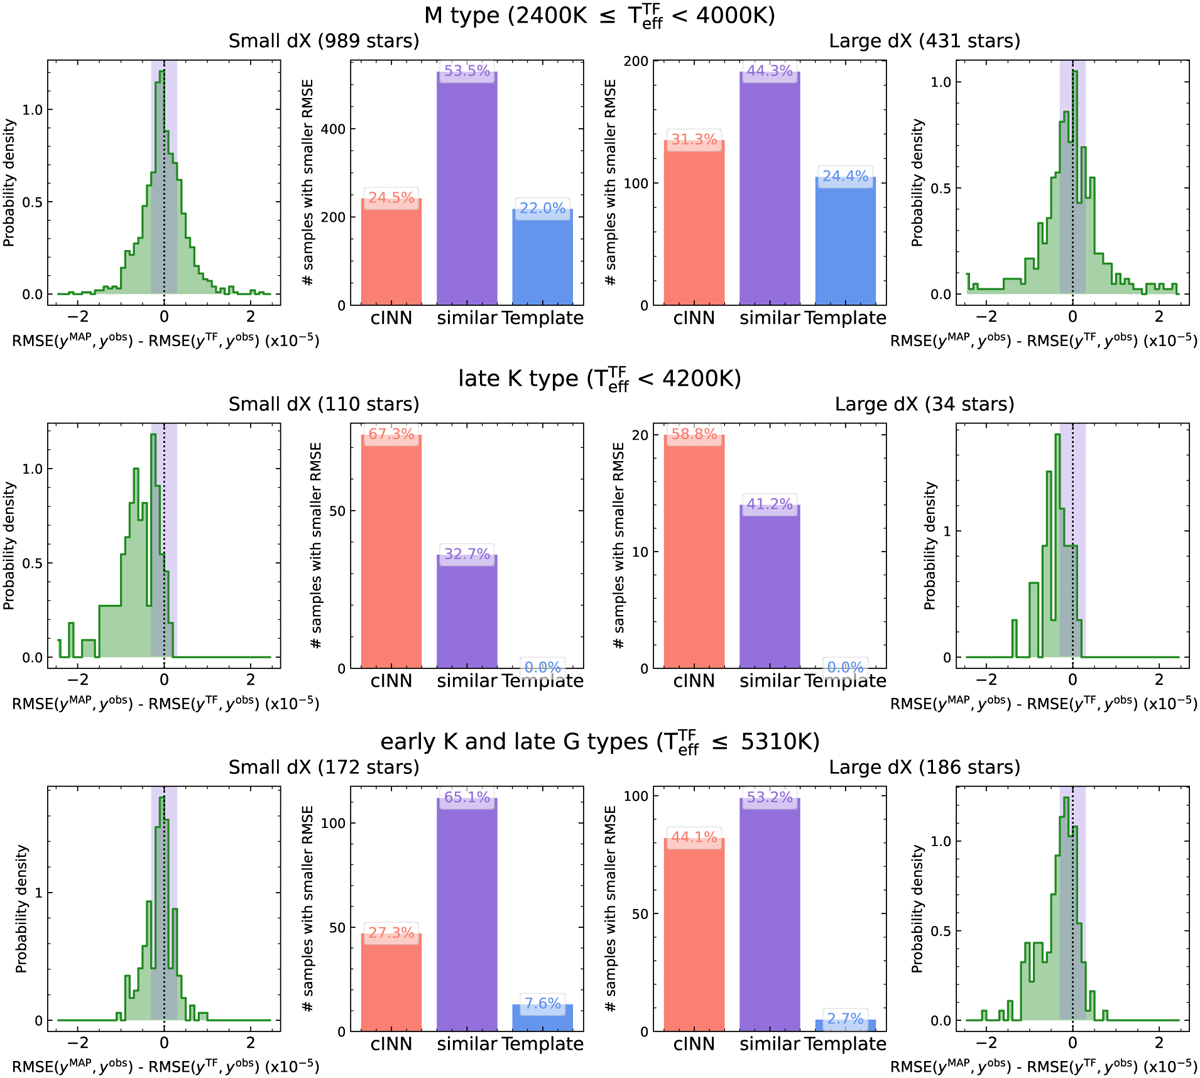
Comparison of RMSE on the observational space for small dX and large dX groups for different ![]() ranges. We use both the Clean and Uncertain groups in this figure. K- or G-type samples are divided into late K types (up to K6 type) and early K and late G types (K4–G9 types). G8-type stars are excluded in this figure. The first and the last columns present the difference between the RMSEs (goodness-of-fit) obtained by the two different methods and the second and third columns show the number of samples where the corresponding method has a better fit to the original input spectrum. Purple bars are the cases where RMSEs of the two methods are similar to within 0.3 × 10⁻⁵.
ranges. We use both the Clean and Uncertain groups in this figure. K- or G-type samples are divided into late K types (up to K6 type) and early K and late G types (K4–G9 types). G8-type stars are excluded in this figure. The first and the last columns present the difference between the RMSEs (goodness-of-fit) obtained by the two different methods and the second and third columns show the number of samples where the corresponding method has a better fit to the original input spectrum. Purple bars are the cases where RMSEs of the two methods are similar to within 0.3 × 10⁻⁵.
Current usage metrics show cumulative count of Article Views (full-text article views including HTML views, PDF and ePub downloads, according to the available data) and Abstracts Views on Vision4Press platform.
Data correspond to usage on the plateform after 2015. The current usage metrics is available 48-96 hours after online publication and is updated daily on week days.
Initial download of the metrics may take a while.