Fig. 11
Download original image
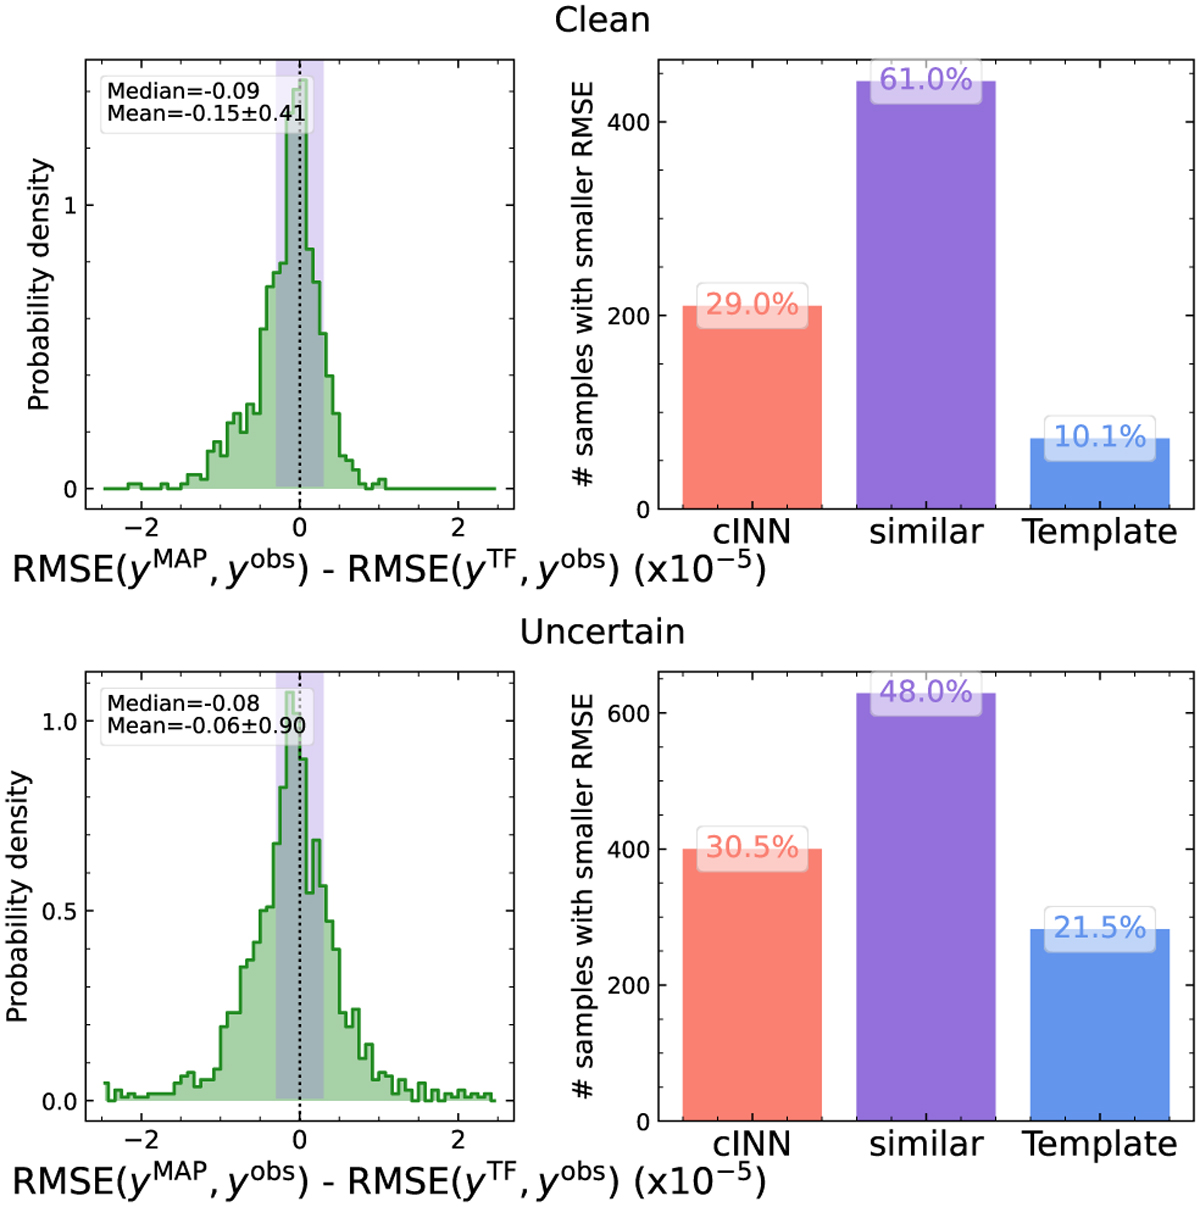
Left: Comparison of the goodness-of-fit on the observational space: the difference between the RMSEs of the resimulated Phoenix spectra and the RMSEs of the modified template spectra. Right panel: Number of samples where the corresponding method has a better fit (i.e. a smaller RMSE) to the original input spectrum. If the difference between the RMSEs is within 0.3 × 10⁻⁵, they are classified as “similar”. These cases are indicated by the purple shaded area in the left panel and a purple bar in the right panel. We use the Clean group in the upper panels and the Uncertain group in the lower panels.
Current usage metrics show cumulative count of Article Views (full-text article views including HTML views, PDF and ePub downloads, according to the available data) and Abstracts Views on Vision4Press platform.
Data correspond to usage on the plateform after 2015. The current usage metrics is available 48-96 hours after online publication and is updated daily on week days.
Initial download of the metrics may take a while.