Fig. 10
Download original image
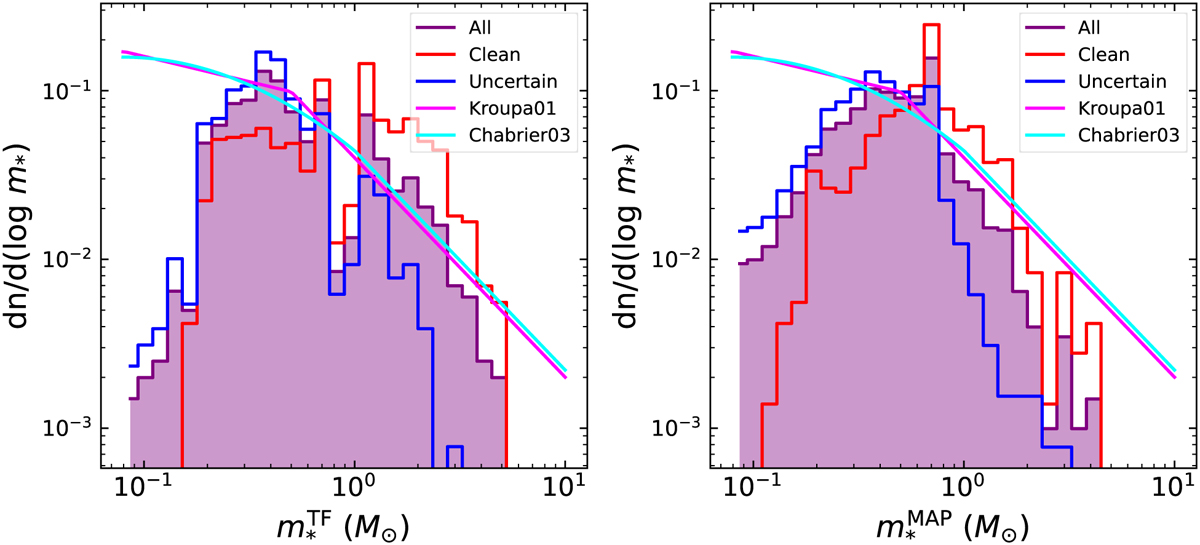
Number density of stars within a given mass bin as a function of stellar mass from the TF parameters (left) and from the MAP values (right). The red and blue lines show the distribution of the Clean and Uncertain sample groups, while the purple lines and purple-shaded areas indicate the distribution of all samples. We present the initial mass functions from Kroupa (2001) and Chabrier (2003) with pink and cyan lines, respectively.
Current usage metrics show cumulative count of Article Views (full-text article views including HTML views, PDF and ePub downloads, according to the available data) and Abstracts Views on Vision4Press platform.
Data correspond to usage on the plateform after 2015. The current usage metrics is available 48-96 hours after online publication and is updated daily on week days.
Initial download of the metrics may take a while.